. 2016 Feb 16:6:21625.
doi: 10.1038/srep21625.

Genetic dissection of plant architecture and yield-related traits in Brassica napus

Affiliations

Genetic dissection of plant architecture and yield-related traits in Brassica napus

Guangqin Cai et al. Sci Rep. .

Abstract

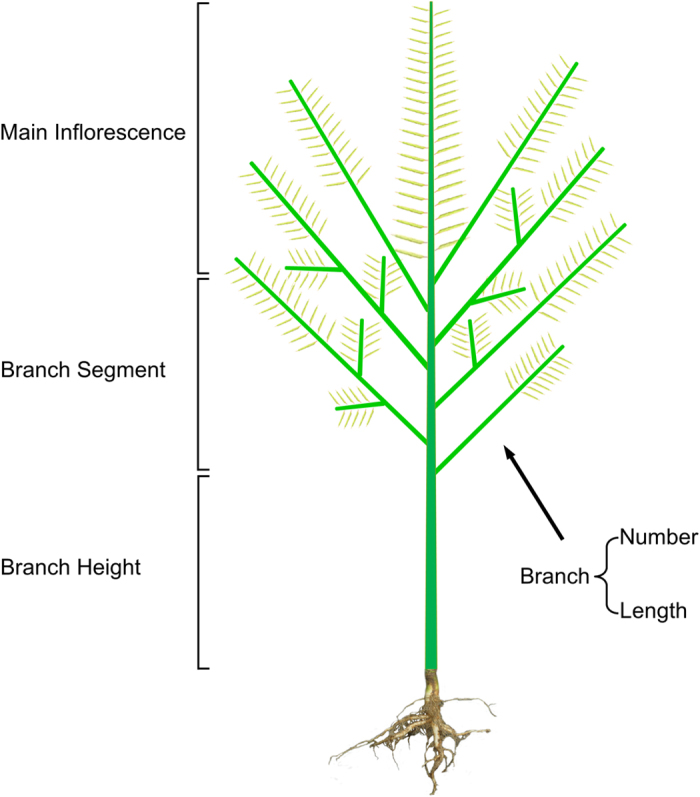
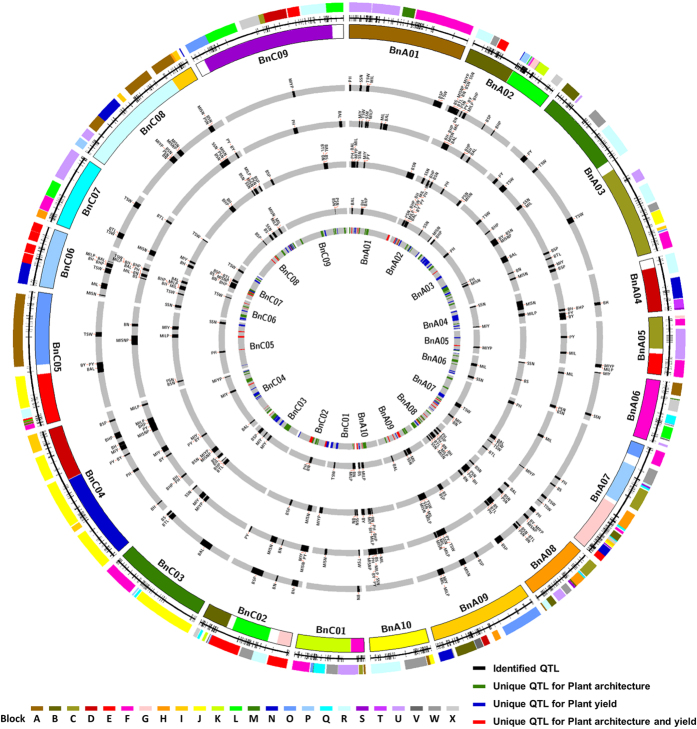
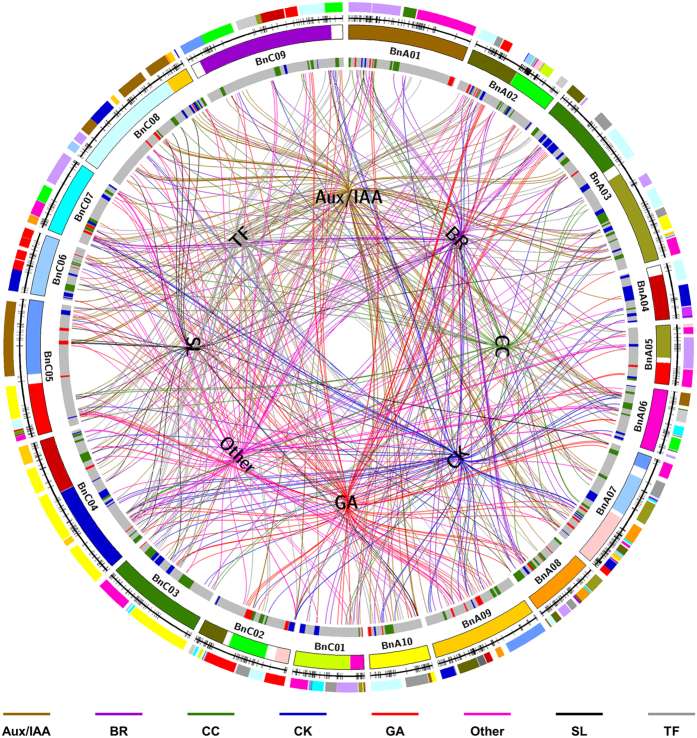
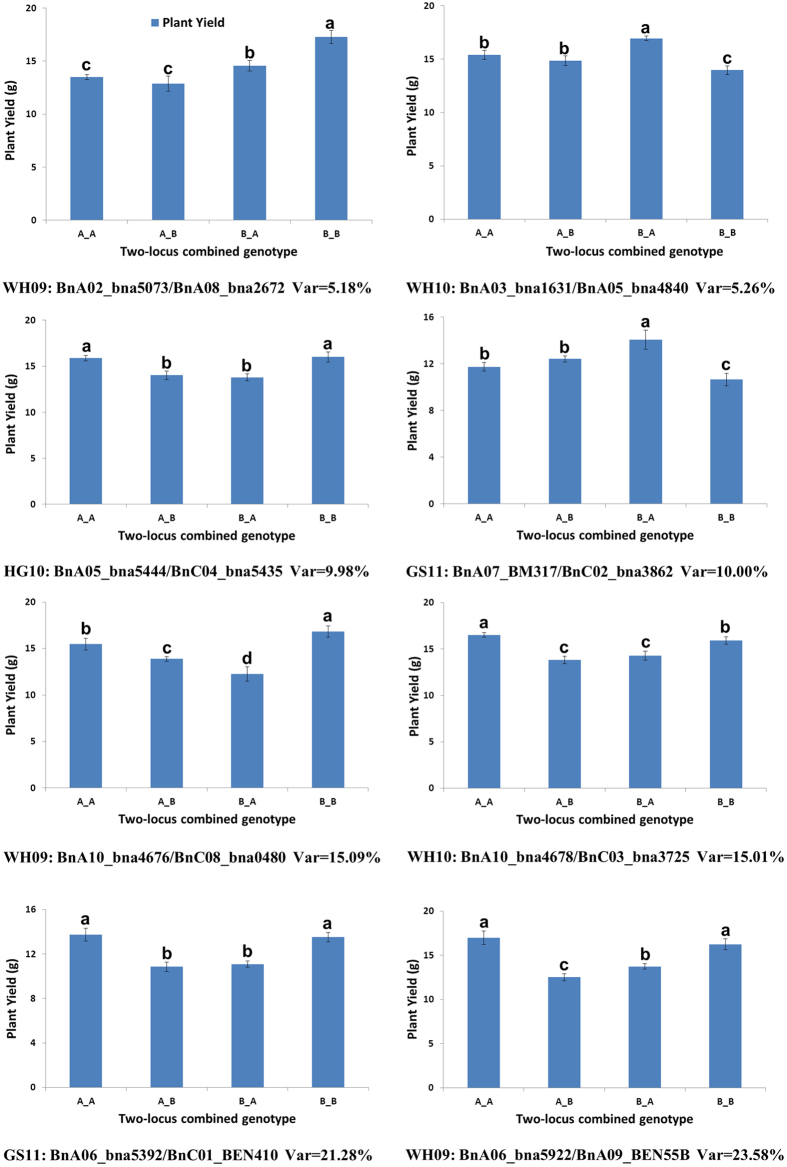
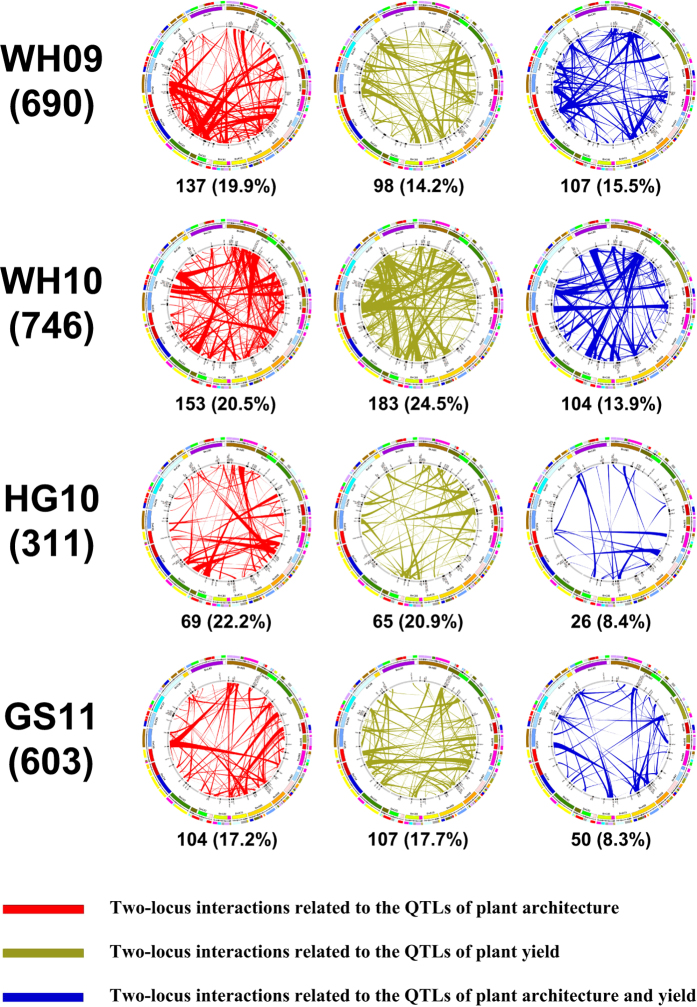
An optimized plant architecture (PA) is fundamental for high-yield breeding but the genetic control of the important trait is largely unknown in rapeseed. Here plant architecture factors (PAFs) were proposed to consist of main inflorescence length proportion (MILP), branch height proportion (BHP), and branch segment proportion (BSP). Comparison of different genotypes in a DH population grown in diverse environments showed that an optimized PAF performance with MILP and BHP between 0.3-0.4 was important for high yield potential. In total, 163 unique quantitative trait loci (QTLs) for PA- and plant yield (PY)-related traits were mapped onto a high-density genetic map. Furthermore, 190 PA-related candidate genes for 91 unique PA QTLs and 2350 PY epistatic interaction loci-pairs were identified, which explain 2.8-51.8% and 5.2-23.6% of phenotypic variation, respectively. Three gene categories, transcription factor, auxin/IAA, and gibberellin, comprise the largest proportions of candidate genes for PA-related QTLs. The effectiveness of QTL candidate genes prediction was demonstrated by cloning of three candidate genes, Bna.A02.CLV2, Bna.A09.SLY2, and Bna.C07.AHK4. The study thus outlines a gene network for control of PA-related traits and provides novel information for understanding the establishment of ideal PA and for developing effective breeding strategies for yield improvement in rapeseed and other crops.


Figures

Figure 1
Figure 1. Schematic diagram of rapeseed plant architecture (PA).
Figure 2
Figure 2. Mapping quantitative trait loci (QTLs) for PA- (plant architecture) and yield- related traits onto the Brassica napus genome.
The colored blocks in the outermost circle represent the conserved Arabidopsis blocks aligned with the B. napus genome identified through single-nucleotide polymorphism/simple sequence repeat (SNP/SSR) markers in the B. napus genetic linkage groups, which are represented by the second outer circle. The third circle represents the B. napus genome reconstructed with fragments of homoeologous exchanges defined by Chalhoub et al.. The fourth to seventh circles represent QTLs identified in WH09, WH10, HG10, and GS11 environments, respectively. The black blocks represent the confidence intervals of the identified QTLs. The inner (eighth) circle represents unique QTLs. The green, blue, and red blocks represent confidence intervals of unique QTLs of PA, PY, or both.
Figure 3
Figure 3. Schematic of homologous plant architecture (PA) genes in Brassica napus.
The colored blocks in the outermost circle represent the conserved Arabidopsis blocks in the B. napus genome identified through single-nucleotide polymorphism/simple sequence repeat (SNP/SSR) markers in the B. napus genetic linkage groups, which are represented by the second outer circle. The third circle represents the B. napus genome reconstructed with fragments of the homoeologous exchanges as defined by Chalhoub et al.. The fourth circle represents the unique QTLs (quantitative trait loci). The inner circle represents 8 categories of PA genes [auxin/indole acetic acid (Aux/IAA), gibberellin (GA), cytokinin (CK), brassinosteroid (BR), strigolactone (SL), transcription factor (TF), cell cycle gene (CC), and other types of genes (Other)]. The lines connect the positions of the category name (in the inner circle) and the positions of genes in the B. napus genetic map (in the fourth circle) of the same category. The different categories are expressed with different color lines.
Figure 4
Figure 4. Verification of two-locus interactions for plant yield (PY).
The X-axis represents the combination of two-locus genotypes of A (Hua_5) and B (J7005). The Y-axis represents the PY average (g), and the error bars represent the standard error. The letters on each column represent statistically significant difference by multiple comparisons at P = 0.05 level.
Figure 5
Figure 5. Schematic diagram for epistatic interaction effects of two-locus interactions of plant yield (PY) with quantitative trait loci (QTLs).
The left column represents the environment of DH population planting, and the number in each bracket is the two-locus interactions of the PY in the corresponding environment. Each panel represents the two-locus interactions of PY located in or overlapping with the confidence intervals of identified QTLs. The colored blocks in the outermost circle represent the conserved Arabidopsis blocks aligned with the B. napus genome identified through SNP/SSR markers in the B. napus genetic linkage groups, which are represented by the second outer circle. The third circle represents the B. napus genome reconstructed with fragments of homoeologous exchanges defined by Chalhoub et al.. The inner circle represents the identified QTLs in the same environment shown in the left column. The red, green, and blue lines represent the interactions related to the QTLs of plant architecture, PY, or both, respectively. The number and percentage in each bracket are the two-locus interactions of the PY corresponding to the colored lines, and the number accounts for the total number (left column) of the two-locus interactions of the PY in the corresponding environment.

References

    1. Busov V. B., Brunner A. M. & Strauss S. H. Genes for control of plant stature and form. New Phytol. 177, 589–607 (2008). - PubMed
    1. Wang Y. & Li J. Molecular basis of plant architecture. Annu. Rev. Plant Biol. 59, 253–279 (2008). - PubMed
    1. Evenson R. E. & Gollin D. Assessing the impact of the Green Revolution, 1960 to 2000. Science 300, 758–762 (2003). - PubMed
    1. Peng J. et al. ‘Green revolution’ genes encode mutant gibberellin response modulators. Nature 400, 256–261 (1999). - PubMed
    1. Jin J. et al. Genetic control of rice plant architecture under domestication. Nat. Genet. 40, 1365–1369 (2008). - PubMed

Publication types

MeSH terms

LinkOut - more resources