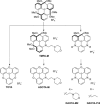
Trianguleniums as Optical Probes for G-Quadruplexes: A Photophysical, Electrochemical, and Computational Study
- PMID: 26880483
- PMCID: PMC4991273
- DOI: 10.1002/chem.201504099
Trianguleniums as Optical Probes for G-Quadruplexes: A Photophysical, Electrochemical, and Computational Study
Abstract
Nucleic acids can adopt non-duplex topologies, such as G-quadruplexes in vitro. Yet it has been challenging to establish their existence and function in vivo due to a lack of suitable tools. Recently, we identified the triangulenium compound DAOTA-M2 as a unique fluorescence probe for such studies. This probe's emission lifetime is highly dependent on the topology of the DNA it interacts with opening up the possibility of carrying out live-cell imaging studies. Herein, we describe the origin of its fluorescence selectivity for G-quadruplexes. Cyclic voltammetry predicts that the appended morpholino groups can act as intra- molecular photo-induced electron transfer (PET) quenchers. Photophysical studies show that a delicate balance between this effect and inter-molecular PET with nucleobases is key to the overall fluorescence enhancement observed upon nucleic acid binding. We utilised computational modelling to demonstrate a conformational dependence of intra-molecular PET. Finally, we performed orthogonal studies with a triangulenium compound, in which the morpholino groups were removed, and demonstrated that this change inverts triangulenium fluorescence selectivity from G-quadruplex to duplex DNA, thus highlighting the importance of fine tuning the molecular structure not only for target affinity, but also for fluorescence response.
Keywords: DNA; nucleic acids; optical probes; quadruplexes; triangulenium.
© 2016 The Authors. Published by Wiley-VCH Verlag GmbH & Co. KGaA.
Figures


Similar articles
-
Assessing The Key Photophysical Properties of Triangulenium Dyes for DNA Binding by Alteration of the Fluorescent Core.Chemistry. 2021 Feb 1;27(7):2523-2536. doi: 10.1002/chem.202003875. Epub 2020 Dec 23. Chemistry. 2021. PMID: 33105523
-
Fluorescent probes for G-quadruplex structures.Chembiochem. 2013 Mar 18;14(5):540-58. doi: 10.1002/cbic.201200612. Epub 2013 Feb 25. Chembiochem. 2013. PMID: 23440895 Review.
-
Triphenylmethane dyes as fluorescent probes for G-quadruplex recognition.Talanta. 2009 Dec 15;80(2):607-13. doi: 10.1016/j.talanta.2009.07.034. Epub 2009 Jul 25. Talanta. 2009. PMID: 19836527
-
Rationally Designed G-Quadruplex Selective "Turn-On" NIR Fluorescent Probe with Large Stokes Shift for Nucleic Acid Research-Based Applications.ACS Appl Bio Mater. 2024 Nov 18;7(11):7233-7243. doi: 10.1021/acsabm.4c00940. Epub 2024 Oct 28. ACS Appl Bio Mater. 2024. PMID: 39466599
-
Recent advances in fluorescent probes for G-quadruplex nucleic acids.Biochem Biophys Res Commun. 2020 Oct 8;531(1):18-24. doi: 10.1016/j.bbrc.2020.02.114. Epub 2020 Feb 25. Biochem Biophys Res Commun. 2020. PMID: 32111356 Review.
Cited by
-
Azadioxatriangulenium and Diazaoxatriangulenium: Quantum Yields and Fundamental Photophysical Properties.ACS Omega. 2017 Jan 24;2(1):193-203. doi: 10.1021/acsomega.6b00211. eCollection 2017 Jan 31. ACS Omega. 2017. PMID: 31457221 Free PMC article.
-
C-Functionalized Cationic Diazaoxatriangulenes: Late-Stage Synthesis and Tuning of Physicochemical Properties.Chemistry. 2018 Jul 17;24(40):10186-10195. doi: 10.1002/chem.201801486. Epub 2018 Jun 25. Chemistry. 2018. PMID: 29698563 Free PMC article.
-
Cationic helicenes as selective G4 DNA binders and optical probes for cellular imaging.Chem Sci. 2021 Oct 15;12(43):14624-14634. doi: 10.1039/d1sc04567a. eCollection 2021 Nov 10. Chem Sci. 2021. PMID: 34881015 Free PMC article.
-
DNA Binding Mode Analysis of a Core-Extended Naphthalene Diimide as a Conformation-Sensitive Fluorescent Probe of G-Quadruplex Structures.Int J Mol Sci. 2021 Sep 30;22(19):10624. doi: 10.3390/ijms221910624. Int J Mol Sci. 2021. PMID: 34638964 Free PMC article.
-
Anion-dependent ion-pairing assemblies of triazatriangulenium cation that interferes with stacking structures.Beilstein J Org Chem. 2024 Oct 10;20:2567-2576. doi: 10.3762/bjoc.20.215. eCollection 2024. Beilstein J Org Chem. 2024. PMID: 39403304 Free PMC article.
References
-
- Neidle S., FEBS J. 2010, 277, 1118–1125. - PubMed
-
- Georgiades S. N., Karim A., Nurul H., Suntharalingam K., Vilar R., Angew. Chem. Int. Ed. 2010, 49, 4020–4034; - PubMed
- Angew. Chem. 2010, 122, 4114–4128.
-
- Ohnmacht S. A., Neidle S., Bioorg. Med. Chem. Lett. 2014, 24, 2602–2612. - PubMed
-
- Monchaud D., Teulade-Fichou M.-P., Org. Biomol. Chem. 2008, 6, 627–636. - PubMed
Publication types
MeSH terms
Substances
LinkOut - more resources
Full Text Sources
Other Literature Sources

