. 2016 Feb 11:5:e13245.
doi: 10.7554/eLife.13245.

Nanoscale dynamics of synaptic vesicle trafficking and fusion at the presynaptic active zone

Affiliations

Nanoscale dynamics of synaptic vesicle trafficking and fusion at the presynaptic active zone

Thirumalini Vaithianathan et al. Elife. .

Abstract

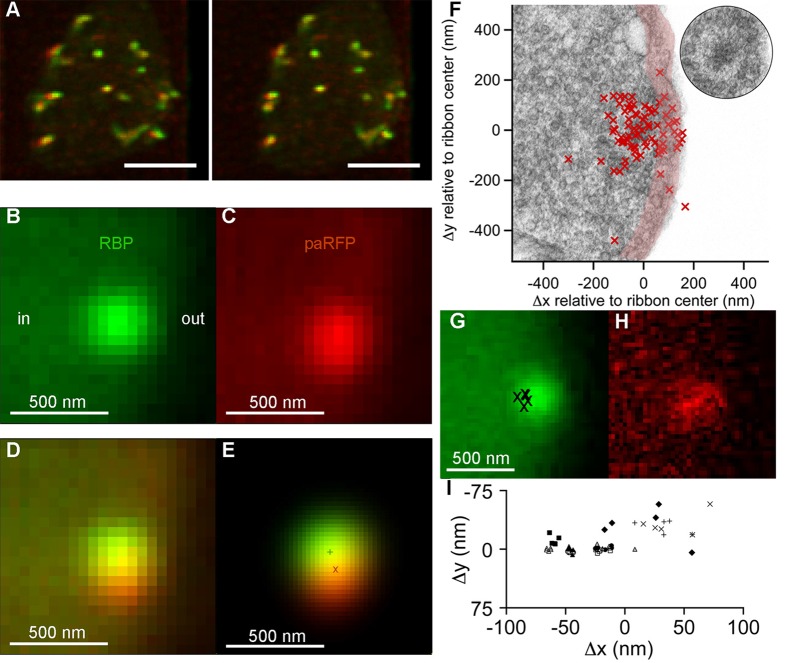
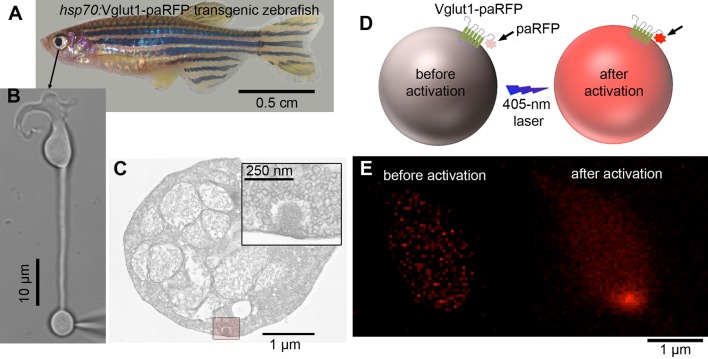
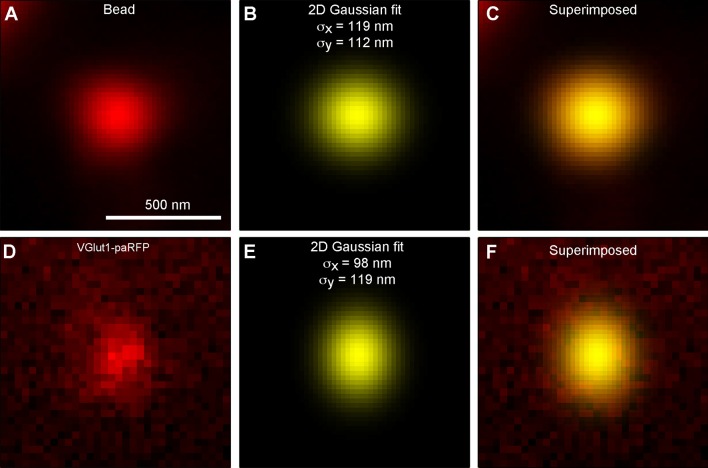
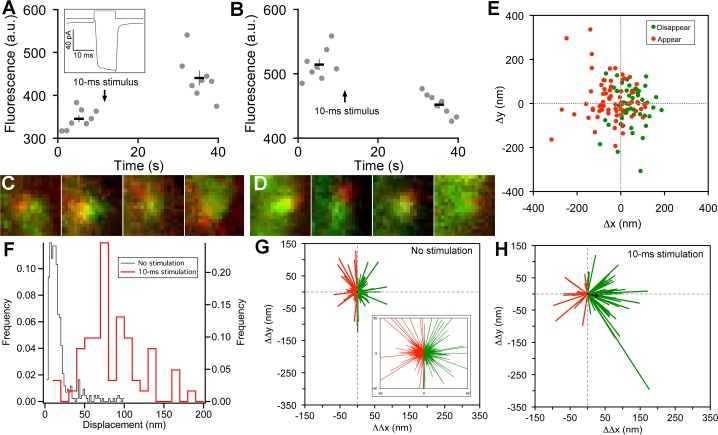
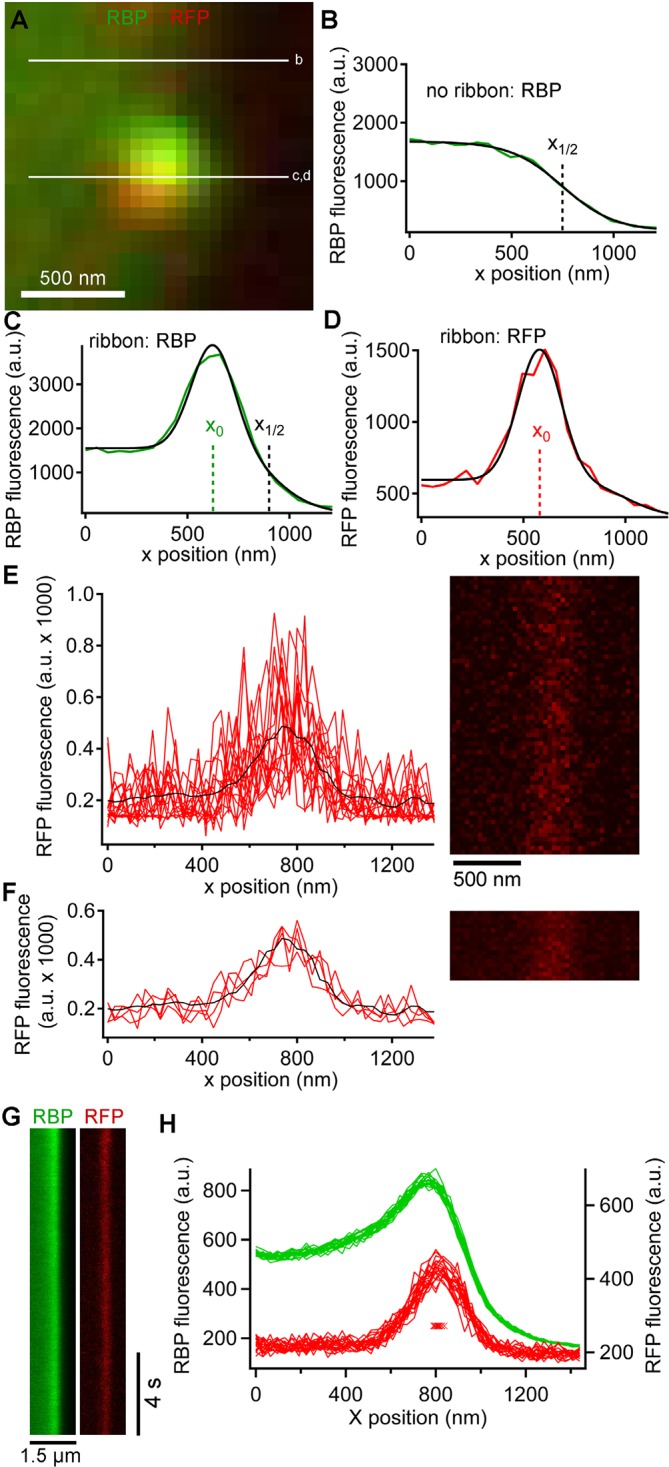
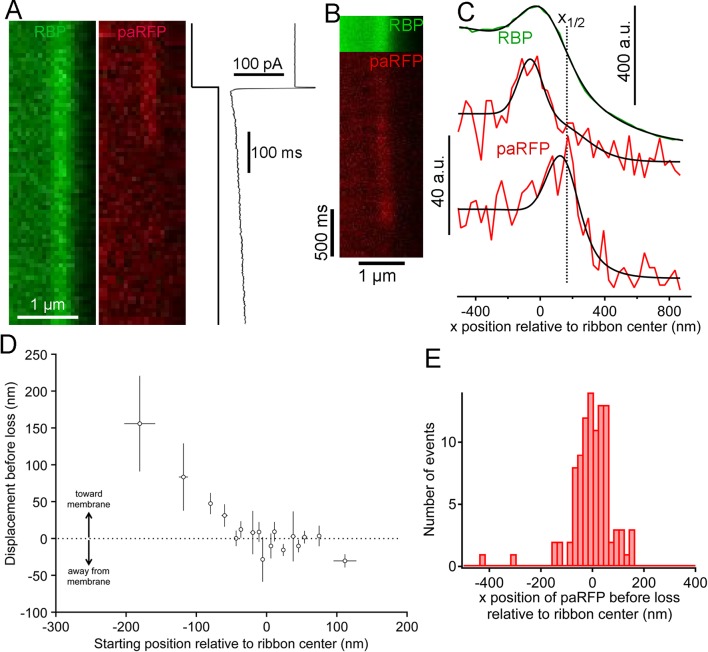
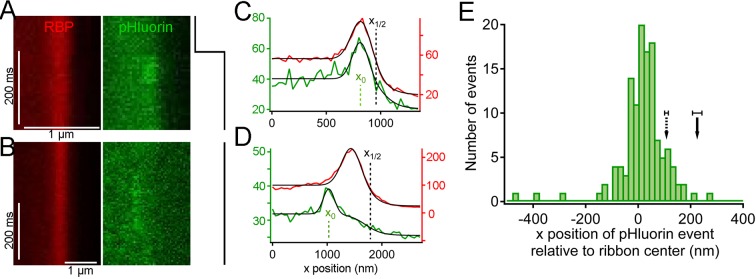
The cytomatrix at the active zone (CAZ) is a macromolecular complex that facilitates the supply of release-ready synaptic vesicles to support neurotransmitter release at synapses. To reveal the dynamics of this supply process in living synapses, we used super-resolution imaging to track single vesicles at voltage-clamped presynaptic terminals of retinal bipolar neurons, whose CAZ contains a specialized structure-the synaptic ribbon-that supports both fast, transient and slow, sustained modes of transmission. We find that the synaptic ribbon serves a dual function as a conduit for diffusion of synaptic vesicles and a platform for vesicles to fuse distal to the plasma membrane itself, via compound fusion. The combination of these functions allows the ribbon-type CAZ to achieve the continuous transmitter release required by synapses of neurons that carry tonic, graded visual signals in the retina.

Keywords: neuroscience; presynaptic mechanisms; retina; synaptic transmission; zebrafish.


Conflict of interest statement

The authors declare that no competing interests exist.

Figures

Figure 1.
Figure 1.. Synaptic vesicles labeled with Vglut1-paRFP stably associate with synaptic ribbons at the active zone.
(A) Stereogram of a 3D reconstruction from a series of confocal optical sections through the synaptic terminal of a zebrafish BPC, showing photoactivated Vglut1-paRFP (red) near synaptic ribbons (green). A rotating view of the reconstruction is provided in Video 2. Scale bar = 2 µm. Details of recording and photoactivation are provided in Figure 1—figure supplement 1. (B) Close-up view of a synaptic ribbon labeled with green-fluorescent RBP, which also fills the cytoplasm. Outside of the cell is to the right, which is the standard orientation adopted for all images. Average of 16 frames. (C) View of the same region showing a single Vglut1-paRFP spot, averaged over 128 frames. (D) Superposition of images from B and C. (E) 2D Gaussians (Figure 1—figure supplement 2) fitted to RBP and paRFP fluorescence, with peaks marked by + and X respectively. (F) Positions of 81 paRFP spots (red Xs) relative to the center of the RBP-labeled ribbon, superimposed on an electron micrograph of a ribbon in a zebrafish BPC. The pink region depicts the ~100-nm region imaged in TIRFM experiments (except that the region would be planar in an actual TIRFM experiment). The inset reproduces the ribbon image without overlaid paRFP centroids. (G) Ribbon image with superimposed positions of a paRFP spot, shown by Xs, followed for 90 s without stimulation. Each position was determined by fitting a 2D Gaussian to a single averaged image of paRFP fluorescence like that shown in H. (H) An example of a single paRFP image, averaged over 10 frames, used to estimate paRFP positions shown in G. (I) Stability of paRFP location in the absence of stimulation for 10 experiments like that illustrated in G and H. Each symbol shows an individual paRFP location, and the different symbol types show results for a particular experiment. DOI: http://dx.doi.org/10.7554/eLife.13245.003
Figure 1—figure supplement 1.
Figure 1—figure supplement 1.. Overview of the experimental procedure.
(A) Retinas were removed from transgenic zebrafish that expressed Vglut1-paRFP fusion protein after heat shock. (B) Intact, acutely dissociated retinal BPCs were voltage-clamped via a whole-cell patch pipette placed on the synaptic terminal. (C) Electron micrograph showing the synaptic terminal of a zebrafish BPC, with the boxed region around a ribbon at higher magnification in the inset. Ribbons are surrounded by tethered synaptic vesicles. (D) Cartoon illustrating photoactivation of paRFP by 405-nm light. (E) Example of red fluorescence in the synaptic terminal before and after photoactivation. DOI: http://dx.doi.org/10.7554/eLife.13245.004
Figure 1—figure supplement 2.
Figure 1—figure supplement 2.. paRFP spots match the point-spread function of the microscope.
(A) X-y image of a 27-nm fluorescent bead. (B) Best fitting 2D Gaussian function for the bead image. (C) 2D Gaussian superimposed on the bead image. (D) X-y image of a stable paRFP-labeled synaptic vesicle in the terminal of a zebrafish BPC. (E) Best fitting 2D Gaussian function for the paRFP image. (F) 2D Gaussian superimposed on the paRFP image. DOI: http://dx.doi.org/10.7554/eLife.13245.005
Figure 2.
Figure 2.. Vesicle release, replenishment, and movement elicited by brief depolarization.
(A) Example of an increase in paRFP fluorescence after a 10-ms depolarization from -60 mV to 0 mV, which evoked the Ca2+ current shown in the inset. Data points show fluorescence for individual frames, and the thick lines show the average ( ± sem) fluorescence over 8 frames before and after the stimulus. (B) An instance where depolarization caused a loss of paRFP fluorescence. (C) Representative examples of averaged images after depolarization for trials in which paRFP-labeled vesicles appeared post-stimulus. (D) Examples of averaged images before depolarization for trials in which paRFP-labeled vesicles disappeared post-stimulus. (E) Loci of paRFP-labeled vesicles with respect to the center of ribbon for 59 disappearances (green circles) and 71 appearances (red circles). (F) Histogram of displacement amplitude after 10-ms stimulation (red line) for 64 paRFP-labeled vesicles that were present before and after depolarization, compared with displacement histogram for 437 paRFP-labeled vesicles in the absence of stimulation (black line). Displacement = (ΔΔx2 + ΔΔy2)0.5, where ΔΔx and ΔΔy are changes in paRFP locus relative to the center of the ribbon. (G) Displacement vectors without stimulation (N=437), shown on an expanded scale in the inset. The black dot in the center is the average vector. (H) Displacement vectors after 10-ms depolarization (N = 64). DOI: http://dx.doi.org/10.7554/eLife.13245.008
Figure 3.
Figure 3.. Generation and analysis of line scan data.
(A) Scan lines were positioned perpendicular to the plasma membrane, extending from the intracellular side of the ribbon into the extracellular space. For illustrative purposes, a second scan line is shown at a non-ribbon location. Lower-case letters show line positions for panels B–D. (B) Intensity profile of green RBP fluorescence at the non-ribbon location. The parameter x1/2 from the sigmoid fit (black line) is taken as the position of the membrane (see Materials and methods). (C) Intensity profile of green RBP fluorescence at the ribbon. The parameter x0 is the peak of the Gaussian fit, giving the x-position of the center of the ribbon (see Materials and methods). (D) Intensity profile of paRFP fluorescence at the ribbon, with the x-position of the labeled vesicle given by x0. (E) Example of x-t image of paRFP spot at a ribbon, consisting of 64 line scans (right) taken over 472 ms. X-axis intensity profiles are plotted (left) for the first 16 line scans to illustrate the noise within and across individual line scans. The superimposed black line shows the average of all 64 lines. (F) Data from E were averaged over four lines to reduce noise and allow more precise localization of the paRFP spot along the x-axis. The intensity profiles show the first four of the temporally averaged line scans, with the average for all lines superimposed in black. (G) Example x-t images averaged over five line scans, showing a stable paRFP-labeled synaptic vesicle associated with a ribbon, which was labeled in green with RBP. Membrane potential was voltage-clamped at -60 mV. (H) Intensity profiles of RBP (green) and paRFP (red) taken in successive 406-ms intervals from the images in G. The red Xs show the position of x0 for each paRFP trace, which varied over a range of 48 nm during the 15-s recording. DOI: http://dx.doi.org/10.7554/eLife.13245.009
Figure 4.
Figure 4.. Movement and loss of vesicles during sustained depolarization.
(A) Example x-t images in which a previously stable paRFP-labeled vesicle disappeared from view during sustained depolarization. The timing of depolarization and the evoked Ca2+ current are shown to the right. Analysis of x-t line scan images is described in Figure 3. (B) Example showing a paRFP-labeled vesicle that appeared distal to the center of the ribbon during sustained depolarization, moved toward the membrane, and disappeared along a Gaussian time course (Figure 4—figure supplement 1). (C) Fluorescence intensity profiles along the x-axis for the example in panel B, showing ribbon position (green) and paRFP positions at appearance and disappearance (red). Black lines are fits described in Figure 3. The dotted line shows the estimated position of the plasma membrane estimated from x1/2 obtained from the fit to RBP fluorescence. (D) Displacement amplitude for 88 paRFP-labeled vesicles along the x-axis prior to disappearance, as a function of initial starting position relative to the center of the ribbon. Positive and negative displacements are movements toward and away from the membrane, respectively. Open circles show the average of groups of five points binned by starting position. Error bars: ± 1 sem. Positive starting positions are nearer the membrane, and negative positions are farther away. (E) Histogram of final positions of paRFP-labeled vesicles along the x-axis just before disappearance. DOI: http://dx.doi.org/10.7554/eLife.13245.010
Figure 4—figure supplement 1.
Figure 4—figure supplement 1.. Fluorescence of an emitter declines along a Gaussian time course as the emitter moves away from the region of a line scan.
(A) The fluorescence of a 27-nm fluorescent bead sampled by a line scan as the bead moved progressively away from the line position. The dashed red line is the best-fitting Gaussian decline. (B) Time course of fluorescence decline for 11 paRFP-labeled synaptic vesicles that disappeared from the scanned line during sustained depolarization. The dashed red line is the best-fitting Gaussian decline. DOI: http://dx.doi.org/10.7554/eLife.13245.011
Figure 5.
Figure 5.. Synaptic vesicle exocytosis reported by pHluorin occurs at a distance from the plasma membrane.
(A) Example of x-t images showing a pHluorin event from SypHy (green) at a ribbon shortly after onset of depolarization from -60 mV to -15 mV, shown by the trace to the right. Ribbon fluorescence from deep-red CF633-RBP is pseudocolored red. (B) Example of x-t images showing a pHluorin event from SypHy (green) on the membrane-distal side of a ribbon (red) in a different cell during depolarization to -15 mV. (C) (D) Fluorescence intensity profiles along the x-axis for RBP (red) and pHluorin (green) for the examples shown in A and B. Black lines are fits as described in Figure 3A–D and in Materials and methods. The x-axis position of the pHluorin event was taken to be the peak of the Gaussian from the fit (x0, shown by the dotted green line), and the position of the plasma membrane was taken to be the parameter x1/2 (dotted black line) from the fit to the fluorescence profile of the ribbon (red traces). (E) Histogram of the x-axis position of 127 pHluorin events from SypHy and Vglut1-pHluorin during sustained depolarization. The solid arrow shows the average relative position of the plasma membrane, estimated as described in Materials and methods (error bar: ± 1 sem). The dashed arrow shows the estimated position of the membrane at the top and bottom of the optical section, arrived at by assuming that membrane curvature observed along the y-axis for each x-y image also applied in the z-axis. Most of the pHluorin events fell outside the range of membrane positions between the two arrows. DOI: http://dx.doi.org/10.7554/eLife.13245.012
Figure 5—figure supplement 1.
Figure 5—figure supplement 1.. Noise level during pHluorin events.
Green traces show x-axis intensity profiles during the example pHluorin events shown in Figure 5. (A, B) Event from Figure 5A. (C,D) Event from Figure 5B. (A, C) The fluorescence profile was averaged over successive groups of four scan lines during the pHluorin event. The black line shows the average over the entire duration of the event (A: 48 scan lines; C: 128 scan lines). The noise level after averaging over four scan lines was insufficient to allow precise localization of the pHluorin emitter. (B, D) The same data from A and C averaged over successive groups of 16 scan lines (B) or 32 scan lines (D), which reduced noise and allowed more precise localization of the event along the x-axis. DOI: http://dx.doi.org/10.7554/eLife.13245.013
Figure 5—figure supplement 2.
Figure 5—figure supplement 2.. Variation in ribbon position in different focal planes.
(A) X-axis profiles of RBP fluorescence were measured after displacing the objective in the z-axis by the indicated relative amounts, spanning the full extent of the labeled ribbon in the z-axis. The gray Xs show fitted values of x0 for the six traces (positions 200–1200 nm) when the ribbon was visible. This is an example of a ribbon that showed little variation in x0 along the z-axis. (B) X-axis profiles of RBP fluorescence obtained in the manner described for A, but for a ribbon that showed larger variation in x0 along the z-axis. (C) Summary of the variation in x0 of the ribbon along the z-axis for 13 experiments. Data were normalized for each experiment by measuring the change in x0 (Δx0) relative to x0 at the brightest focal position for that experiment. DOI: http://dx.doi.org/10.7554/eLife.13245.014

Similar articles

Cited by

References

    1. Betzig E, Patterson GH, Sougrat R, Lindwasser OW, Olenych S, Bonifacino JS, Davidson MW, Lippincott-Schwartz J, Hess HF. Imaging intracellular fluorescent proteins at nanometer resolution. Science. 2006;313:1642–1645. doi: 10.1126/science.1127344. - DOI - PubMed
    1. Francis AA, Mehta B, Zenisek D. Development of new peptide-based tools for studying synaptic ribbon function. Journal of Neurophysiology. 2011;106:1028–1037. doi: 10.1152/jn.00255.2011. - DOI - PMC - PubMed
    1. Granseth B, Odermatt B, Royle SJ, Lagnado L. Clathrin-mediated endocytosis is the dominant mechanism of vesicle retrieval at hippocampal synapses. Neuron. 2006;51:773–786. doi: 10.1016/j.neuron.2006.08.029. - DOI - PubMed
    1. Graydon CW, Zhang J, Oesch NW, Sousa AA, Leapman RD, Diamond JS. Passive diffusion as a mechanism underlying ribbon synapse vesicle release and resupply. Journal of Neuroscience. 2014;34:8948–8962. doi: 10.1523/JNEUROSCI.1022-14.2014. - DOI - PMC - PubMed
    1. Gundelfinger ED, Fejtova A. Molecular organization and plasticity of the cytomatrix at the active zone. Current Opinion in Neurobiology. 2012;22:423–430. doi: 10.1016/j.conb.2011.10.005. - DOI - PubMed

Publication types

Substances