. 2016 Mar 7;213(3):433-49.
doi: 10.1084/jem.20150806. Epub 2016 Feb 15.

Functional screen identifies regulators of murine hematopoietic stem cell repopulation

Affiliations

Functional screen identifies regulators of murine hematopoietic stem cell repopulation

Per Holmfeldt et al. J Exp Med. .

Erratum in

Abstract

Understanding the molecular regulation of hematopoietic stem and progenitor cell (HSPC) engraftment is paramount to improving transplant outcomes. To discover novel regulators of HSPC repopulation, we transplanted >1,300 mice with shRNA-transduced HSPCs within 24 h of isolation and transduction to focus on detecting genes regulating repopulation. We identified 17 regulators of HSPC repopulation: Arhgef5, Armcx1, Cadps2, Crispld1, Emcn, Foxa3, Fstl1, Glis2, Gprasp2, Gpr56, Myct1, Nbea, P2ry14, Smarca2, Sox4, Stat4, and Zfp251. Knockdown of each of these genes yielded a loss of function, except in the cases of Armcx1 and Gprasp2, whose loss enhanced hematopoietic stem cell (HSC) repopulation. The discovery of multiple genes regulating vesicular trafficking, cell surface receptor turnover, and secretion of extracellular matrix components suggests active cross talk between HSCs and the niche and that HSCs may actively condition the niche to promote engraftment. We validated that Foxa3 is required for HSC repopulating activity, as Foxa3(-/-) HSC fails to repopulate ablated hosts efficiently, implicating for the first time Foxa genes as regulators of HSPCs. We further show that Foxa3 likely regulates the HSC response to hematologic stress. Each gene discovered here offers a window into the novel processes that regulate stable HSPC engraftment into an ablated host.


Figures

Figure 1.
Figure 1.
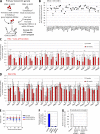
Functional screen for regulators of HSPC in vivo repopulation. (A) Screen schematic. 51 prioritized genes were assessed by qRT-PCR for expression in LSK cells. miR30-embedded shRNAs targeting each gene expressed in LSK cells were cloned into a lentiviral vector downstream of the MSCV promoter. Here, the phosphoglycerate kinase (PGK) promoter drives mCherry. (B) Heat map of qRT-PCR of GOI in LSK cells, Lineage cells, and Lineage+ cells. Scale indicates gene expression relative to population expressing the highest level of each gene across each row (1 = dark red). (C) BM LSK cells transduced with shRNAs were assayed 3–4 d after transduction for mCherry. Each circle is an independent transduction event. (D) BM LSK cells transduced with shRNAs were examined 3–4 d after transduction by qRT-PCR. Each circle is an independently screened shRNA. Circles in red denote shRNAs used in the screen. (E) Transduction efficiency (%mCherry+) of LSK cells and HSCs (i.e., LSK CD150+CD48) at multiple MOI 4 d after transduction.
Figure 2.
Figure 2.
Identification of genes required for HSPC in vivo repopulation. (A) shRNAs were transduced into CD45.2+ Test LSK cells that were then transplanted into CD45.1+/CD45.2+ mice with an equal number of CD45.1+ mock-transduced Competitor LSK cells. Recipient PB was analyzed for >16 wk for CD45.2+ cells. (B) Transduction of Test LSK cells for each screen transplant. For each transplant, an aliquot of Test cells was assessed for the percentage of mCherry+ cells 4 d after transduction. Each circle represents an independent transduction. (C and D) Loss-of-function hits (C) and non-hits (D). Percentage of CD45.2 PB 4 and >16 wk after transplant of recipients of gene-specific shRNA–treated Test cells normalized to that of recipients of control shRNA–treated Test cells. Each gene was interrogated with two independent shRNAs (labeled as a and b). (E) Percentage of CD45.2 PB of mice transplanted with Grb10 shRNA or control shRNA–transduced Test cells. Knockdown of Grb10 had no effect on LSK cell repopulating activity. (F) LSK cells transduced with control or Grb10 shRNAs were examined 4 d after transduction for the percentage of mCherry+ cells. (G) 30 wk after transplant, CD45.2+ LSK cells were isolated from the BM of individual mice transplanted with CD45.2+ LSK cells transduced with either control or Grb10 shRNAs. These cells were examined by qRT-PCR for Grb10 transcript levels. For C–F, the mean of five recipient mice is presented, and error bars represent SD. For C, a one-sample Student’s t test was performed testing the null hypothesis that the normalized measurements = 1. P-values are two-sided. §, P < 0.1; *, P < 0.05; **, P < 0.005; ***, P < 0.0001. Only p-values calculated >16 wk after transplant are shown.
Figure 3.
Figure 3.
Validation of loss-of-function hits identifies 15 genes required for robust HSPC repopulating activity. (A) For retesting hits, mCherry+CD45.2+ Test HSPCs (LSK cells) transduced with either control or gene-specific shRNAs were transplanted into CD45.1+/CD45.2+ mice with an equal number of CD45.1+ mock-transduced and mock-sorted Competitor HSPCs. Recipient PB was analyzed for >16 wk for CD45.2+ cells. (B) Representative flow cytometry analysis of LSK cell and HSCs (i.e., LSK CD150+CD48) 40 h after transduction with control shRNA lentiviral vector. Samples were examined for the frequency of mCherry+ cells. (C) Transduction efficiency (percentage of mCherry+ cells) of Test LSK cells transduced with Smarca2 and Zfp521 shRNAs in primary screen. (D) Knockdown efficacy of shRNAs targeting Smarca2, Zfp521, and Zbtb20 assessed by qRT-PCR 3–4 d after transduction of LSK cells. (E) Verified loss-of-function hits. A one sample Student’s t test was performed testing the null hypothesis that the normalized measurements = 1. P-values are two-sided. §, P < 0.1; *, P < 0.05; **, P < 0.005; ***, P < 0.0001. Only p-values calculated >16 wk after transplant are shown. (F) Functional screen non-hits. In E and F, each gene was interrogated with at least two independent shRNAs (labeled as a, b, or c) and the percentage of CD45.2 PB at 4 and >16 wk after transplant of recipients of gene-specific shRNA–treated Test cells normalized to that of recipients of control shRNA–treated Test cells is shown. (G) Distribution of T, B, and myeloid PB lineages in mCherry+CD45.2+ compartment of genes that scored as hits after retesting >16 wk after transplant. In E–G, each bar is the average of at least four recipient mice, and error bars represent SD. In G, asterisks denote a statistically significant difference in distribution of at least one lineage relative to control for both shRNAs tested (P < 0.05). P-values were calculated using the exact Wilcoxon Mann-Whitney test. ND, not determined.
Figure 4.
Figure 4.
Functional screen identifies Gprasp2 and Armcx1 as negative regulators of HSPC repopulation. (A) Gprasp2 or control shRNAs were transduced into CD45.2+ LSK cells that were then transplanted into CD45.1+/CD45.2+ mice with an equal number of CD45.1+ mock-transduced Competitor LSK cells. Recipient PB was analyzed for 20 wk. Percentage of mCherry+ CD45.2+ PB of recipients of Gprasp2 shRNA–treated cells normalized to the percentage of mCherry+CD45.2+ PB of recipients of control shRNA–treated cells. Gprasp2 was tested in two independent experiments with three shRNAs (a–c). Cumulative results shown for both experiments (n ≥ 5 at all time points). (B) Validation of gain-of-function hits (Gprasp2, Armcx1, and Leprel2). Gprasp2, Leprel2, Armcx1, or control shRNAs were transduced into CD45.2+ HSPCs. mCherry+ HSPCs were resorted 40 h after transfection and transplanted either 1:1 or 1:4 with CD45.1+ mock-transduced and mock-sorted Competitor HSPCs into CD45.1+/CD45.2+ mice. Data shown is the percentage of CD45.2+ recipient PB of gene-specific shRNA–treated cells normalized to that of recipients of control shRNA–treated cells at >16 wk after transplant for 1:1 (i) or 1:4 (ii) transplants. Armcx1 was examined with three shRNAs (a–c) in a single (i) and three (ii) independent experiments. Gprasp2 was interrogated with two shRNAs (b and d) in a single experiment (ii). Leprel2 was examined with two shRNAs (a and b) in a single experiment for both i and ii. (C) Distribution of T, B, and myeloid PB lineages in mCherry+CD45.2+ compartment of gain-of-function hits from >16 wk after transplant. In A and C, each value is the mean of n ≥ 5 mice; error bars represent SD. *, P < 0.04; **, P < 0.008. P-values were calculated via exact Wilcoxon Mann-Whitney test.
Figure 5.
Figure 5.
Functional analysis of screen hits. (A) 500 mCherry+ LSK cells transduced with control or gene-specific shRNAs were assayed for CFU potential 5 d after transduction. Values are the mean of two to three independent experiments normalized to control ± SE. (B) Cell cycle status of the mCherry+ LSK cell compartment, the frequency of mCherry+ LSK cells, and apoptosis of mCherry+ LSK cells was analyzed 5 d after transduction with control or gene-specific shRNAs. Values are the mean of two to three independent experiments normalized to control ± SE. For A and B, a one-sample Student’s t test was performed testing the null hypothesis that the normalized measurements = 1. P-values are two-sided. §, P < 0.1; *, P < 0.05; **, P < 0.005. (C) Heat map summarizing mean percentage of CD45.2+ (Test cell–derived) HSC, MPP, CMP, CLP, GMP, and MEP in recipients >16 wk after transplant. Values are normalized to control recipients (i.e., 1 = yellow). Higher chimerism relative to control = darker green; lower chimerism relative to control = darker red. ND, not determined.
Figure 6.
Figure 6.
Foxa3 is dispensable for native hematopoiesis but required for HSC repopulating potential. (A) qRT-PCR of Foxa3 transcript. (B) PB counts of Foxa3+/+, Foxa3−/+, and Foxa3−/− littermates. (C) Absolute number of HSPCs in one femur + one tibia + one pelvis of 6–10-wk-old Foxa3−/− (n = 5), Foxa3−/+ (n = 6), and Foxa3+/+ (n = 2) littermates. In B and C, each circle represents an independent mouse. (D) CFU activity of 150 Foxa3−/− (n = 5) or Foxa3+/+ (n = 5) HSCs. Error bars = SD. P = 6.2 × 10⁻⁶. (E) Schematic showing Foxa3−/− or Foxa3+/+ HSC strategies. (F) For first degree transplants, CD45.2+ Foxa3−/− or Foxa3+/+ WBM was transplanted with CD45.1+ WBM into ablated CD45.1+/CD45.2+ recipients in a 1:1 ratio. Percentage of CD45.2+ recipient PB at 20 wk after transplant is shown (*, P = 0.03). For 2° transplants, CD45.2+ WBM was isolated from 1° recipients 16 wk after transplant and transplanted into ablated CD45.1+/CD45.2+ mice. %CD45.2+ recipient PB is shown 16 wk after transplant for 2° transplant recipients (***, P = 0.0001). Each circle is an independently transplanted mouse. (G) The LSK, HSC, and MPP compartments of 1° recipients of CD45.2+ Foxa3−/− (n = 12) or Foxa3+/+ (n = 11) cells were examined >16 wk after transplant for the absolute number of CD45.2+ cells (shown as number of cells/one femur + one tibia + one pelvis). Each circle is an independent mouse. P = 0.02, 0.08, and 0.04, respectively. (H) 15,000, 30,000, 50,000, 100,000, or 200,000 CD45.2+ Foxa3−/− or Foxa3+/+ WBM cells were transplanted with CD45.1+ WBM into CD45.1+/CD45.2+ recipients. Recipients were scored as repopulated if their CD45.2+ PB chimerism was >1% in the T cell, B cell, and myeloid cell lineages 10–16 wk after transplant (data are the pooled results of two independently performed limiting dilution transplants). Each circle is an individual recipient (black circles label engrafted mice and red circles label nonengrafted mice). The number of mice engrafted/number of mice transplanted at each cell dose is shown. Significantly fewer repopulating HSCs were detected in Foxa3−/− WBM than Foxa3+/+ WBM (P = 0.0046). χ2 analysis revealed a fit to the limiting dilution model (Table S3). These analyses were performed using L-Calc.
Figure 7.
Figure 7.
Foxa3 protects HSCs from cellular stress. (A) Genes predicted by IM-PET to be targets of FOXA3 binding motif+ LT-HSC enhancers (Table S5) are significantly more perturbed in expression among genes differentially expressed between Foxa3−/− and Foxa3+/+ HSCs (Table S6). P = 2.6 × 10⁻²⁹. (B) CD45.2+ LSK CD150+CD48 cells were isolated from first degree recipients of Foxa3+/+ (n = 6) and Foxa3−/− (n = 7) BM and then stained with DCFDA to assess endogenous ROS levels (left) or treated with TBHP before DCFDA staining to induce elevated ROS (right). Values represent the percentage of cells positive for DCFDA in Foxa3−/− cells relative to Foxa3+/+ cells (left) or the relative fold change of DCFDA+ cells in Foxa3−/− versus Foxa3+/+ CD45.2+ LSK CD150+CD48 after TBHP treatment (right). For the left graph, P = 0.001 (*). P-values were calculated via exact Wilcoxon Mann-Whitney test.

References

    1. Abu-Helo A., and Simonin F.. 2010. Identification and biological significance of G protein-coupled receptor associated sorting proteins (GASPs). Pharmacol. Ther. 126:244–250. 10.1016/j.pharmthera.2010.03.004 - DOI - PubMed
    1. Ali N., Karlsson C., Aspling M., Hu G., Hacohen N., Scadden D.T., and Larsson J.. 2009. Forward RNAi screens in primary human hematopoietic stem/progenitor cells. Blood. 113:3690–3695. 10.1182/blood-2008-10-176396 - DOI - PMC - PubMed
    1. Ashburner M., Ball C.A., Blake J.A., Botstein D., Butler H., Cherry J.M., Davis A.P., Dolinski K., Dwight S.S., Eppig J.T., et al. The Gene Ontology Consortium . 2000. Gene ontology: tool for the unification of biology. Nat. Genet. 25:25–29. 10.1038/75556 - DOI - PMC - PubMed
    1. Behr R., Sackett S.D., Bochkis I.M., Le P.P., and Kaestner K.H.. 2007. Impaired male fertility and atrophy of seminiferous tubules caused by haploinsufficiency for Foxa3. Dev. Biol. 306:636–645. 10.1016/j.ydbio.2007.03.525 - DOI - PMC - PubMed
    1. Boitano A.E., Wang J., Romeo R., Bouchez L.C., Parker A.E., Sutton S.E., Walker J.R., Flaveny C.A., Perdew G.H., Denison M.S., et al. . 2010. Aryl hydrocarbon receptor antagonists promote the expansion of human hematopoietic stem cells. Science. 329:1345–1348. 10.1126/science.1191536 - DOI - PMC - PubMed

Publication types

Substances