

NIH peer review percentile scores are poorly predictive of grant productivity
- PMID: 26880623
- PMCID: PMC4769156
- DOI: 10.7554/eLife.13323
NIH peer review percentile scores are poorly predictive of grant productivity
Abstract
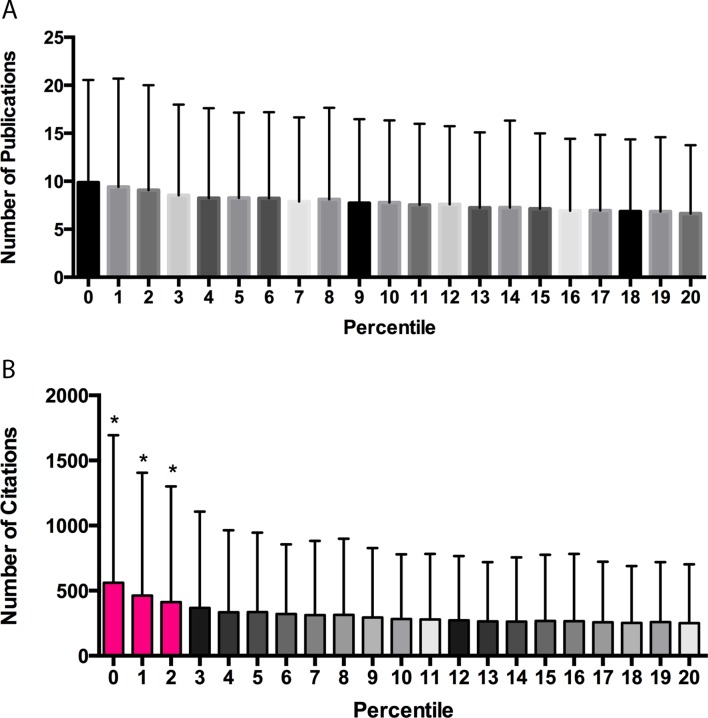
Peer review is widely used to assess grant applications so that the highest ranked applications can be funded. A number of studies have questioned the ability of peer review panels to predict the productivity of applications, but a recent analysis of grants funded by the National Institutes of Health (NIH) in the US found that the percentile scores awarded by peer review panels correlated with productivity as measured by citations of grant-supported publications. Here, based on a re-analysis of these data for the 102,740 funded grants with percentile scores of 20 or better, we report that these percentile scores are a poor discriminator of productivity. This underscores the limitations of peer review as a means of assessing grant applications in an era when typical success rates are often as low as about 10%.
Keywords: grants; human biology; medicine; national institute of health; none; peer review; policy; research funding.
Conflict of interest statement
The authors declare that no competing interests exist.
Figures
Similar articles
-
Predicting Productivity Returns on Investment: Thirty Years of Peer Review, Grant Funding, and Publication of Highly Cited Papers at the National Heart, Lung, and Blood Institute.Circ Res. 2015 Jul 17;117(3):239-43. doi: 10.1161/CIRCRESAHA.115.306830. Epub 2015 Jun 18. Circ Res. 2015. PMID: 26089369 Free PMC article.
-
Research funding. Big names or big ideas: do peer-review panels select the best science proposals?Science. 2015 Apr 24;348(6233):434-8. doi: 10.1126/science.aaa0185. Epub 2015 Apr 23. Science. 2015. PMID: 25908820
-
Scholarly productivity and national institutes of health funding of foundation for anesthesia education and research grant recipients: insights from a bibliometric analysis.Anesthesiology. 2015 Sep;123(3):683-91. doi: 10.1097/ALN.0000000000000737. Anesthesiology. 2015. PMID: 26114414
-
US-National Institutes of Health-funded research for cutaneous wounds in 2012.Wound Repair Regen. 2013 Nov-Dec;21(6):789-92. doi: 10.1111/wrr.12099. Epub 2013 Oct 17. Wound Repair Regen. 2013. PMID: 24134696 Review.
-
Current state of funded National Institutes of Health grants focused on individuals living with advanced and metastatic cancers: a portfolio analysis.J Cancer Surviv. 2021 Jun;15(3):370-374. doi: 10.1007/s11764-021-01008-8. Epub 2021 Mar 2. J Cancer Surviv. 2021. PMID: 33651327 Review.
Cited by
-
Getting funded in a highly fluctuating environment: Shifting from excellence to luck and timing.PLoS One. 2022 Nov 7;17(11):e0277337. doi: 10.1371/journal.pone.0277337. eCollection 2022. PLoS One. 2022. PMID: 36342950 Free PMC article.
-
Reply to "Funding by Lottery: Political Problems and Research Opportunities".mBio. 2016 Aug 30;7(4):e01401-16. doi: 10.1128/mBio.01401-16. mBio. 2016. PMID: 27578762 Free PMC article. No abstract available.
-
A retrospective analysis of the peer review of more than 75,000 Marie Curie proposals between 2007 and 2018.Elife. 2021 Jan 13;10:e59338. doi: 10.7554/eLife.59338. Elife. 2021. PMID: 33439120 Free PMC article.
-
Can Oncologists Predict the Efficacy of Treatments in Randomized Trials?Oncologist. 2021 Jan;26(1):56-62. doi: 10.1634/theoncologist.2020-0054. Epub 2020 Aug 26. Oncologist. 2021. PMID: 32936509 Free PMC article.
-
Alternative models of funding curiosity-driven research.Proc Natl Acad Sci U S A. 2025 Feb 4;122(5):e2401237121. doi: 10.1073/pnas.2401237121. Epub 2025 Jan 27. Proc Natl Acad Sci U S A. 2025. PMID: 39869812 Free PMC article.
References
-
- Berg J. Productivity metrics and peer review scores. https://loop.nigms.nih.gov/2011/06/productivity-metrics-and-peer-review-... NIGMS Feedback Loop Blog. 2011
-
- Berg J. On deck chairs and lifeboats. http://www.asbmb.org/asbmbtoday/asbmbtoday_article.aspx?id=32362 ASBMB Today. 2013
MeSH terms
LinkOut - more resources
Full Text Sources
Other Literature Sources
