Dynamic functional network connectivity reveals unique and overlapping profiles of insula subdivisions
- PMID: 26880689
- PMCID: PMC4837017
- DOI: 10.1002/hbm.23135
Dynamic functional network connectivity reveals unique and overlapping profiles of insula subdivisions
Abstract
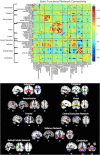
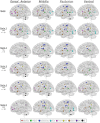
The human insular cortex consists of functionally diverse subdivisions that engage during tasks ranging from interoception to cognitive control. The multiplicity of functions subserved by insular subdivisions calls for a nuanced investigation of their functional connectivity profiles. Four insula subdivisions (dorsal anterior, dAI; ventral, VI; posterior, PI; middle, MI) derived using a data-driven approach were subjected to static- and dynamic functional network connectivity (s-FNC and d-FNC) analyses. Static-FNC analyses replicated previous work demonstrating a cognition-emotion-interoception division of the insula, where the dAI is functionally connected to frontal areas, the VI to limbic areas, and the PI and MI to sensorimotor areas. Dynamic-FNC analyses consisted of k-means clustering of sliding windows to identify variable insula connectivity states. The d-FNC analysis revealed that the most frequently occurring dynamic state mirrored the cognition-emotion-interoception division observed from the s-FNC analysis, with less frequently occurring states showing overlapping and unique subdivision connectivity profiles. In two of the states, all subdivisions exhibited largely overlapping profiles, consisting of subcortical, sensory, motor, and frontal connections. Two other states showed the dAI exhibited a unique connectivity profile compared with other insula subdivisions. Additionally, the dAI exhibited the most variable functional connections across the s-FNC and d-FNC analyses, and was the only subdivision to exhibit dynamic functional connections with regions of the default mode network. These results highlight how a d-FNC approach can capture functional dynamics masked by s-FNC approaches, and reveal dynamic functional connections enabling the functional flexibility of the insula across time. Hum Brain Mapp 37:1770-1787, 2016. © 2016 Wiley Periodicals, Inc.
Keywords: default mode network; dynamic functional network connectivity; flexibility; insular cortex; limbic system; resting state fMRI; salience network.
© 2016 Wiley Periodicals, Inc.
Figures


Similar articles
-
Structural Connections of Functionally Defined Human Insular Subdivisions.Cereb Cortex. 2018 Oct 1;28(10):3445-3456. doi: 10.1093/cercor/bhx211. Cereb Cortex. 2018. PMID: 28968768 Free PMC article.
-
Dynamic functional network connectivity in idiopathic generalized epilepsy with generalized tonic-clonic seizure.Hum Brain Mapp. 2017 Feb;38(2):957-973. doi: 10.1002/hbm.23430. Epub 2016 Oct 11. Hum Brain Mapp. 2017. PMID: 27726245 Free PMC article.
-
Altered Static and Dynamic Functional Network Connectivity and Combined Machine Learning in Stroke.Brain Topogr. 2025 Jan 9;38(2):21. doi: 10.1007/s10548-024-01095-7. Brain Topogr. 2025. PMID: 39789164
-
Anterior insula as a gatekeeper of executive control.Neurosci Biobehav Rev. 2022 Aug;139:104736. doi: 10.1016/j.neubiorev.2022.104736. Epub 2022 Jun 11. Neurosci Biobehav Rev. 2022. PMID: 35700753 Review.
-
The Insula: A "Hub of Activity" in Migraine.Neuroscientist. 2016 Dec;22(6):632-652. doi: 10.1177/1073858415601369. Epub 2015 Aug 19. Neuroscientist. 2016. PMID: 26290446 Free PMC article. Review.
Cited by
-
Chronnectomic patterns and neural flexibility underlie executive function.Neuroimage. 2017 Feb 15;147:861-871. doi: 10.1016/j.neuroimage.2016.10.026. Epub 2016 Oct 22. Neuroimage. 2017. PMID: 27777174 Free PMC article.
-
Whole-Brain Functional Dynamics Track Depressive Symptom Severity.Cereb Cortex. 2021 Oct 1;31(11):4867-4876. doi: 10.1093/cercor/bhab047. Cereb Cortex. 2021. PMID: 33774654 Free PMC article.
-
Dynamic functional connectivity in schizophrenia and autism spectrum disorder: Convergence, divergence and classification.Neuroimage Clin. 2019;24:101966. doi: 10.1016/j.nicl.2019.101966. Epub 2019 Aug 1. Neuroimage Clin. 2019. PMID: 31401405 Free PMC article.
-
State and trait characteristics of anterior insula time-varying functional connectivity.Neuroimage. 2020 Mar;208:116425. doi: 10.1016/j.neuroimage.2019.116425. Epub 2019 Dec 2. Neuroimage. 2020. PMID: 31805382 Free PMC article.
-
Insula network connectivity mediates the association between childhood maltreatment and depressive symptoms in major depressive disorder patients.Transl Psychiatry. 2022 Mar 2;12(1):89. doi: 10.1038/s41398-022-01829-w. Transl Psychiatry. 2022. PMID: 35236833 Free PMC article.
References
-
- Agcaoglu O, Miller R, Cetin M, Calhoun VD (2015): Connectivity differences between cerebral hemispheres at rest. Annual Meeting of the Organization for Human Brain Mapping; Honolulu, HI.
-
- Barrett LF, Wager TD (2006): The structure of emotion evidence from neuroimaging studies. Curr Direct Psychol Sci 15:79–83.
Publication types
MeSH terms
Grants and funding
LinkOut - more resources
Full Text Sources
Other Literature Sources
Research Materials
Miscellaneous

