. 2016 Apr;57(4):616-30.
doi: 10.1194/jlr.M065896. Epub 2016 Feb 15.

Mogat1 deletion does not ameliorate hepatic steatosis in lipodystrophic (Agpat2-/-) or obese (ob/ob) mice

Affiliations

Mogat1 deletion does not ameliorate hepatic steatosis in lipodystrophic (Agpat2-/-) or obese (ob/ob) mice

Anil K Agarwal et al. J Lipid Res. 2016 Apr.

Abstract

Reducing triacylglycerol (TAG) in the liver continues to pose a challenge in states of nonalcoholic hepatic steatosis. MonoacylglycerolO-acyltransferase (MOGAT) enzymes convert monoacylglycerol (MAG) to diacylglycerol, a precursor for TAG synthesis, and are involved in a major pathway of TAG synthesis in selected tissues, such as small intestine. MOGAT1 possesses MGAT activity in in vitro assays, but its physiological function in TAG metabolism is unknown. Recent studies suggest a role for MOGAT1 in hepatic steatosis in lipodystrophic [1-acylglycerol-3-phosphateO-acyltransferase (Agpat)2(-/-)] and obese (ob/ob) mice. To test this, we deletedMogat1in theAgpat2(-/-)andob/obgenetic background to generateMogat1(-/-);Agpat2(-/-)andMogat1(-/-);ob/obdouble knockout (DKO) mice. Here we report that, despite the absence ofMogat1in either DKO mouse model, we did not find any decrease in liver TAG by 16 weeks of age. Additionally, there were no measureable changes in plasma glucose (diabetes) and insulin resistance. Our data indicate a minimal role, if any, of MOGAT1 in liver TAG synthesis, and that TAG synthesis in steatosis associated with lipodystrophy and obesity is independent of MOGAT1. Our findings suggest that MOGAT1 likely has an alternative function in vivo.

Keywords: 1-acylglycerol-3-phosphate O-acyltransferase 2; diabetes; fatty liver; lipodystrophy; monoacylglycerol O-acyltransferase 1; ob/ob.


Figures

Fig. 1.
Fig. 1.
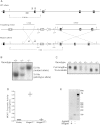
Strategy for homologous Mogat1 deletion in mouse and mutant MOGAT1 enzymatic activity. A: The map of the genomic sequence spanning exons 1–5, marked as boxes, of WT Mogat1. Exon 2 was replaced with a neomycin resistance cassette (Neo) and herpes simplex virus thymidine kinase (HSV-tk) driven by phosphoglycerate kinase 1 promoter (PGK). Primers for genotyping are marked as P1, P2, and P3 and restriction sites as XhoI (X), NotI (N), and HindIII (H). B: The expected genomic DNA fragments digested with HindIII in the WT, Mogat1+/−, and Mogat1−/− mice. C: Northern blot analysis of transcripts from WT, Mogat1+/−, and Mogat1−/− mouse kidney probed with 32P-labeled full length cDNA showing the deletion of exon 2. D: MGAT enzymatic activity in Sf9 insect cells expressing WT and exon 2-3 deleted (ΔE2-3) Mogat1. Shown is the individual enzymatic activity (n = 2) carried out in duplicate; the solid line represents the mean. E: Amplification of the Mogat1 transcript in livers of Agpat2−/− and Mogat1−/−;Agpat2−/− mice with primer pairs located in exon 1 and exon 4. The amplified PCR product was analyzed on a 2% agarose gel stained with ethidium bromide, confirming the deletion of exon 2-3 in the Mogat1 mRNA, and further confirmed by Sanger sequencing. Image colors have been inverted for clarity.
Fig. 2.
Fig. 2.
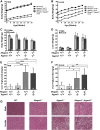
Liver TAG in the Mogat1−/−;Agpat2−/− mice compared with Agpat2−/− mice remains unchanged. A, B: There was no significant difference in body weight for either male or female Mogat1−/−;Agpat2−/− versus Agpat2−/− mice. C: Body weight of all the four genotypes studied at 16 weeks. Each bar represents mean ± SD (n = 13–22), notice there is no change in the body weights between Mogat1−/−;Agpat2−/− versus Agpat2−/− mice at 16 weeks. D: Liver weight of all the four genotypes studied. Each bar represents mean ± SD (n = 13–22); again, no change in the liver weight was observed between Mogat1−/−;Agpat2−/− compared with those of Agpat2−/− at 16 weeks of age. E, F: Liver TAG in male and female mice of all the four genotypes. Each bar represents mean ± SD (n = 6–10). G: Shown are the representative images obtained from one mouse of each sex for H and E staining. *P < 0.05, **P < 0.001, and ***P ≤ 0.0001 obtained using one-way ANOVA.
Fig. 3.
Fig. 3.
Plasma metabolites in 16-week-old mice from WT, Mogat1−/−, Agpat2−/−, and Mogat1−/−;Agpat2−/− mice. A–C: Shown are the plasma levels for TAGs (A), cholesterol (B), and glucose (C). Each bar represents mean ± SD from groups of mice (n = 6–10). D–I: Shown also are VO2 (D), VCO2 (E), cumulative water consumption (F), cumulative food consumption (G), and RER (H, I) for each genotype for both the sexes (n = 4–7). Error bars in (H, I) are shown only for genotypes Agpat2−/− and Mogat1−/−;Agpat2−/− mice for clarity. All calorimetric measurements are normalized to lean mass as determined by NMR (data not shown). Numbers within the bars indicate the number of mice for each genotype. n.s., not significant. *P < 0.05, **P < 0.001, and ***P < 0.0001 obtained using one-way ANOVA.
Fig. 4.
Fig. 4.
Oral glucose tolerance test (OGTT) in WT, Mogat1−/−, Agpat2−/−, and Mogat1−/−;Agpat2−/− mice. Shown are the box and whisker plots: the boxes extend from the 25th to 75th percentiles and the line represents the median. The whiskers extend from the minimum to the maximum values. A, B: Glucose and insulin levels after 6 h fast in male mice. There are seven to eight mice in each genotype studied. C: Glucose clearance upon oral gavage of glucose solution in male mice (see Methods for details). D, E: Glucose and insulin levels after 6 h fast in female mice. There are five to seven mice in each genotype studied. F: Glucose clearance upon oral gavage of glucose solution in female mice (see Methods for details). n.s., not significant. *P < 0.05 obtained using one-way ANOVA.
Fig. 5.
Fig. 5.
Mixed meal tolerance test (MTT) in WT, Mogat1−/−, Agpat2−/−, and Mogat1−/−;Agpat2−/− mice. Shown are the box and whisker plots: the boxes extend from the 25th to 75th percentiles and the line represents the median. The whiskers extend from the minimum to the maximum values. A–D: Levels of glucose (A, B) and insulin (C, D) upon oral gavage of a mixed meal in mice of both sexes (see Methods for details). Glucose and insulin were measured at 0 min (before the start of the gavage) and after 60 min. There are five to eight mice in each genotype for the MTT. n.s., not significant. *P < 0.05, **P < 0.001, and ***P < 0.0001 obtained using mixed effects model repeated measures analysis.
Fig. 6.
Fig. 6.
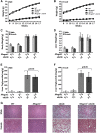
Decreased liver TAG in female Mogat1−/−;ob/ob mice compared with ob/ob mice. A, B: There was no noticeable change in the body weights between Mogat1−/−;ob/ob versus ob/ob by 17 weeks. The number of animals varied between 3 and 22 at various time points. C, D: No change in the body or liver weights was observed in Mogat1−/−;ob/ob compared with those of ob/ob alone at 16 weeks of age. E, F: Liver TAG was decreased in the Mogat1−/−;ob/ob mice compared with those of ob/ob mice, but reached statistical significance only in female mice. The number of animals varied between 7 and 15 for the genotypes studied. G: Representative images of liver from WT, Mogat1−/−, ob/ob, and Mogat1−/−;ob/ob at 16 weeks of age. Shown are the representative images obtained from one mouse of each sex and stained with H and E.
Fig. 7.
Fig. 7.
Plasma metabolites in 16-week-old mice from WT, Mogat1−/−, ob/ob, and Mogat1−/−;ob/ob mice. A–C: Shown are the plasma levels for TAGs (A), cholesterol (B), and glucose (C). Each bar represents mean ± SD from groups of mice (n = 9–15). D–I: Calorimetric measurements of mice from all four genotypes. Shown are VO2 (D), VCO2 (E), cumulative water consumption (F), cumulative food consumption (G), and RER (H, I). Error bars in (H, I) are shown only for the genotypes Agpat2−/− and Mogat1−/−;Agpat2−/− for clarity (n = 3–4 for each genotype for both the sexes). All calorimetric measurements are normalized to lean mass as determined by NMR (data not shown). n.s., not significant. *P < 0.05, **P < 0.001, and ***P < 0.0001 obtained using one-way ANOVA.
Fig. 8.
Fig. 8.
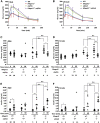
Oral glucose tolerance test (OGTT) and meal tolerance test (MTT) in WT, Mogat1−/−, ob/ob, and Mogat1−/−;ob/ob mice. A, B: Glucose disposal in mice upon oral glucose gavage which remains unremarkable in Mogat1−/−;ob/ob compared with ob/ob mice from both sexes. There are six to seven mice in each genotype studied presented as mean ± SD. C–F: Levels of glucose (C, D) and insulin (E, F) upon oral gavage of a mixed meal (see Methods for details). Glucose and insulin were measured at 0 min (before start of the gavage) and after 60 min. Individual data points are plotted with a horizontal line representing the mean. There are five to eleven mice in each genotype for MTTs. n.s., not significant. *P < 0.05, **P < 0.001, and ***P < 0.0001.

References

    1. Hammarstedt A., Graham T. E., and Kahn B. B.. 2012. Adipose tissue dysregulation and reduced insulin sensitivity in non-obese individuals with enlarged abdominal adipose cells. Diabetol. Metab. Syndr. 4: 42. - PMC - PubMed
    1. Agarwal A. K., and Garg A.. 2006. Genetic basis of lipodystrophies and management of metabolic complications. Annu. Rev. Med. 57: 297–311. - PubMed
    1. Agarwal A. K., and Garg A.. 2006. Genetic disorders of adipose tissue development, differentiation, and death. Annu. Rev. Genomics Hum. Genet. 7: 175–199. - PubMed
    1. Garg A., and Agarwal A. K.. 2009. Lipodystrophies: disorders of adipose tissue biology. Biochim. Biophys. Acta. 1791: 507–513. - PMC - PubMed
    1. Garg A. 2011. Lipodystrophies: genetic and acquired body fat disorders. J. Clin. Endocrinol. Metab. 96: 3313–3325. - PMC - PubMed

Publication types

MeSH terms