. 2016 Feb 16:3:160005.
doi: 10.1038/sdata.2016.5.

Spatiotemporal patterns of population in mainland China, 1990 to 2010

Affiliations

Spatiotemporal patterns of population in mainland China, 1990 to 2010

Andrea E Gaughan et al. Sci Data. .

Abstract

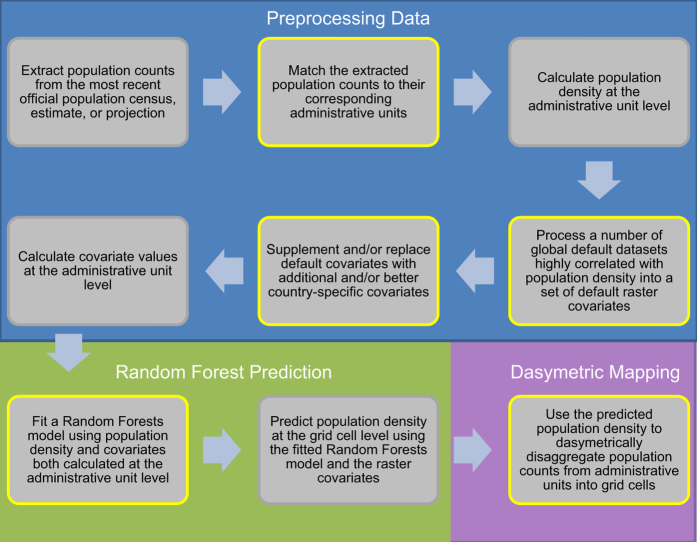
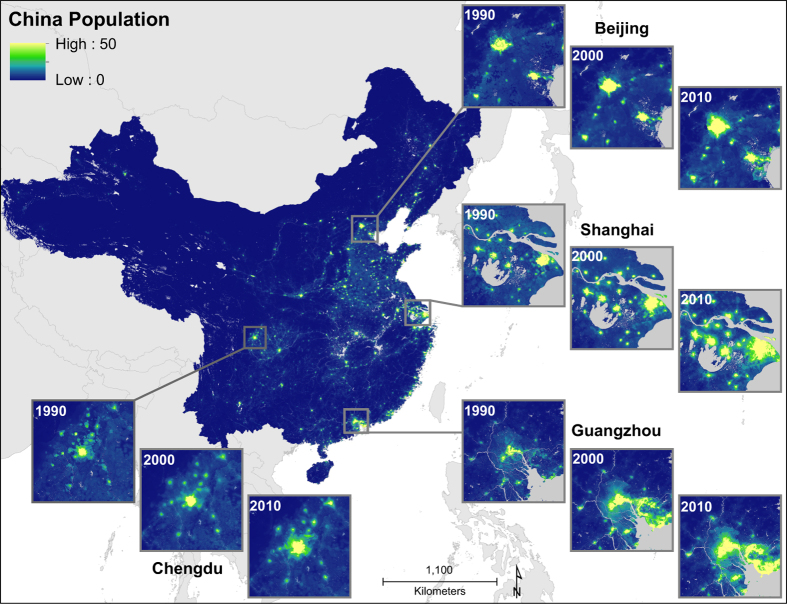
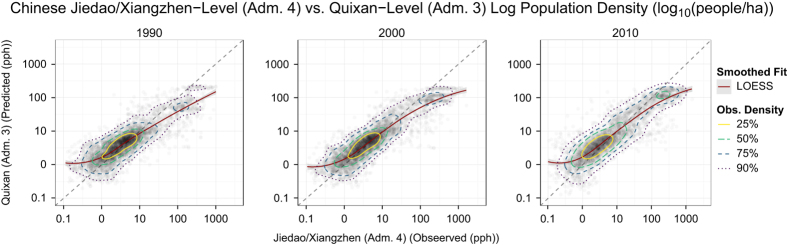
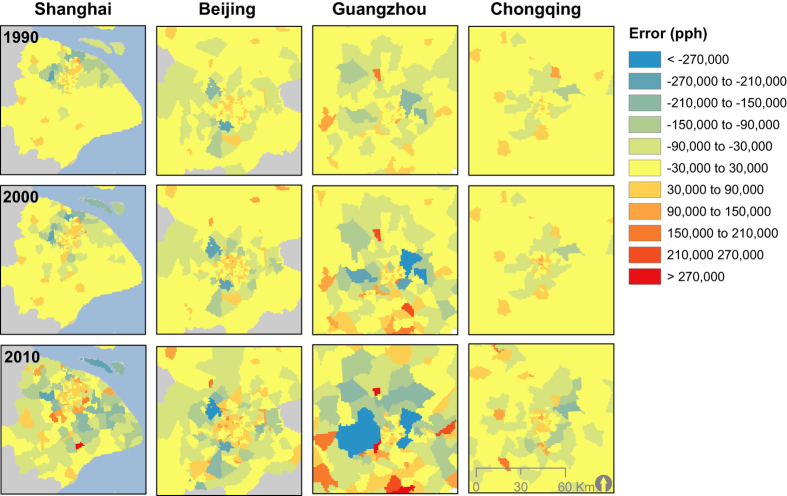
According to UN forecasts, global population will increase to over 8 billion by 2025, with much of this anticipated population growth expected in urban areas. In China, the scale of urbanization has, and continues to be, unprecedented in terms of magnitude and rate of change. Since the late 1970s, the percentage of Chinese living in urban areas increased from ~18% to over 50%. To quantify these patterns spatially we use time-invariant or temporally-explicit data, including census data for 1990, 2000, and 2010 in an ensemble prediction model. Resulting multi-temporal, gridded population datasets are unique in terms of granularity and extent, providing fine-scale (~100 m) patterns of population distribution for mainland China. For consistency purposes, the Tibet Autonomous Region, Taiwan, and the islands in the South China Sea were excluded. The statistical model and considerations for temporally comparable maps are described, along with the resulting datasets. Final, mainland China population maps for 1990, 2000, and 2010 are freely available as products from the WorldPop Project website and the WorldPop Dataverse Repository.


Conflict of interest statement

The Authors declare that they have no competing financial interests that might have influenced the presentation of the temporally-comparable WorldPop Chinese datasets for 1990, 2000 and 2010 nor with the method used to create and assess them.

Figures

Figure 1
Figure 1. Flow diagram of the WorldPop approach to mapping population.
Conceptual overview of the Random Forest-based dasymetric mapping approach used to produce the ‘WorldPop’ datasets including the key steps that involve adjustments to make final population datasets comparable over time (modified from Stevens et al. ). Three primary processing stages are highlighted in the blue, green and purple areas of the figure. Steps outlined in yellow are those that are needed for producing temporally-comparable datasets.
Figure 2
Figure 2. Specific steps for temporally-explicit WorldPop modeling approach.
Overview of the modeling process. Temporally-explicit data include census data, DMSP lights at night data, and urban extents by year.
Figure 3
Figure 3. Hypothetical illustrations of the underlying relationship for prediction density (P d ) and distance to built-area-edge (d) when there is an assumption that the relationship does not change over time (a) and when the relationship does change over time (b).
Figure 4
Figure 4. Percent increased mean square error which indicates the variable importance for each year’s Random Forest regression.
Variable importance for each year’s Random Forest regression, presented as the percent increased mean squared error when the variable is used but randomly resampled for producing out-of-bag (internally cross-validated) predictions. Each model with representative variables shown by the color bars above were used to produce the density weighting layer for the dasymetrically distributed population map, respectively.
Figure 5
Figure 5. Predicted people per grid cell across mainland China with subsets highlighting the specific years 1990, 2000, and 2010.
Estimated people per grid cell across mainland China for 1990, 2000, and 2010 (grid cell resolution is 3 arc seconds, or ~100 meters at the equator). The Tibet Autonomous Region, Taiwan, and the islands in the South China Sea (except for the Hainan Island) were excluded. Projection is in Asia Lambert Conformal and grid cell value represent people per hectare (pph).
Figure 6
Figure 6. Model fit between the predicted population unit counts at the Jiedao/Xiangzhen unit compared to the original census counts at the same unit level.
Comparison of validation unit counts divided by unit area (population density) on a log10-log10 scale with those estimated from maps produced using coarser census units. Jiedao/Xiangzhen (Admin. Level 4) were used as validation units and estimated population maps were produced using Quixan (Admin. Level 3) data. The Jiedao/Xiangzhen units represent the finest level census data available for the urban centers of Shanghai, Beijing, Guangdong and Chongqing ((4,274 validation units (1990), 4,274 validation units (2000), 3,265 validation units (2010)). This comparison is an estimate of overall model fit at the Admin. Level 4 level. Contours are plotted at observation density thresholds above which the specified percentage of observations are found. The smoothed fit line showing overall trend is estimated by LOESS (Cleveland, et al. 1992) (ref. 42) (smoothing parameter alpha=0.75).
Figure 7
Figure 7. Errors shown in people per hectare based on the validation analysis for year.
Errors produced from the validation calculation for each population distribution year for Shanghai, Beijing, Gaungdong and Chongqing. Population underestimates are highlighted in blue and overestimated values are shown in red.

References

Data Citations

    1. Stevens F. R. 2015. Figshare. http://figshare.com/articles/WorldPop_RF/1491490
    1. Gaughan A. E. 2015. Harvard Dataverse. http://dx.doi.org/10.7910/DVN/8HHUDG - DOI

References

    1. United Nations, D. o. E. a. S. A. Population Division. World Urbanization Prospects: The 2014 Revision, Highlights (United Nations, New York, 2014).
    1. United Nations Development Program. China Human Development Report 2013: Sustainable and Livable Cities: Toward Ecological Urbanisation (China Translation and Publishing Corporation: Beijing, 2013).
    1. Buhaug H. & Urdal H. An urbanization bomb? Population growth and social disorder in cities. Global Environ. Chang. 23, 1–10 (2013).
    1. Mennis J. Generating surface models of population using dasymetric mapping. Prof. Geogr. 55, 31–42 (2003).
    1. Stevens F. R., Gaughan A. E., Linard C. & Tatem A. J. Disaggregating census data for population mapping using Random Forests with remotely-sensed and ancillary data. PloS ONE 10, e0107042 (2015). - PMC - PubMed

Publication types