. 2016 Feb 16;114(4):435-43.
doi: 10.1038/bjc.2016.12. Epub 2016 Feb 4.

Non-thermal atmospheric plasma induces ROS-independent cell death in U373MG glioma cells and augments the cytotoxicity of temozolomide

Affiliations

Non-thermal atmospheric plasma induces ROS-independent cell death in U373MG glioma cells and augments the cytotoxicity of temozolomide

Gillian E Conway et al. Br J Cancer. .

Abstract

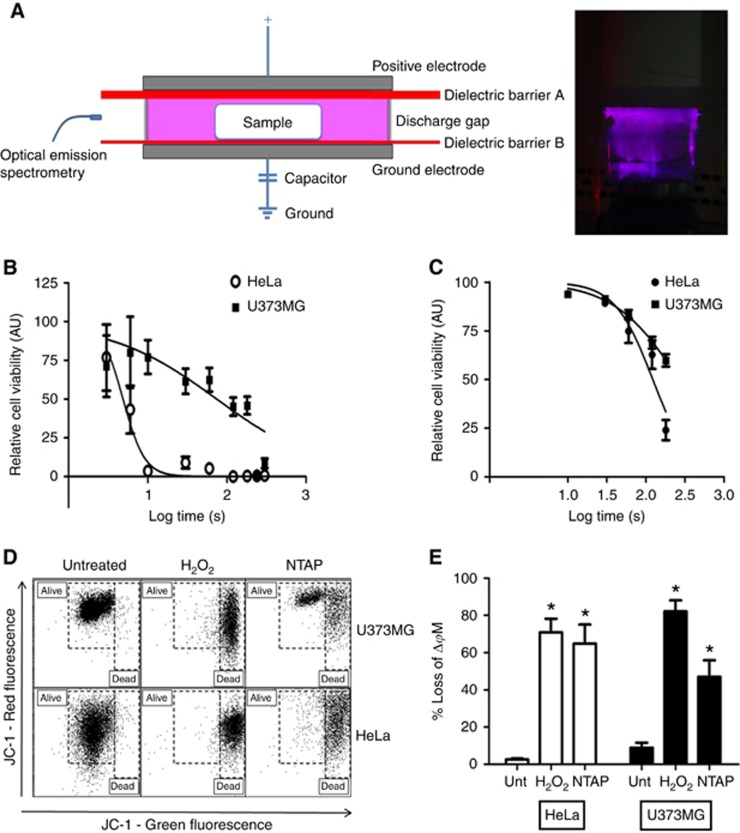
Background: Non-thermal atmospheric plasma (NTAP) is an ionised gas produced under high voltage that can generate short-lived chemically active species and induce a cytotoxic insult in cancer cells. Cell-specific resistance to NTAP-mediated cytotoxicity has been reported in the literature. The aim of this study was to determine whether resistance against NTAP could be overcome using the human glioma cell line U373MG.

Methods: Non-thermal atmospheric plasma was generated using a Dielectric Barrier Device (DBD) system with a maximum voltage output of 120 kV at 50 Hz. The viability of U373MG GBM cells and HeLa cervical carcinoma cells was determined using morphology, flow cytometry and cytotoxicity assays. Fluorescent probes and inhibitors were used to determine the mechanisms of cytotoxicity of cells exposed to the plasma field. Combinational therapy with temozolomide (TMZ) and multi-dose treatments were explored as mechanisms to overcome resistance to NTAP.

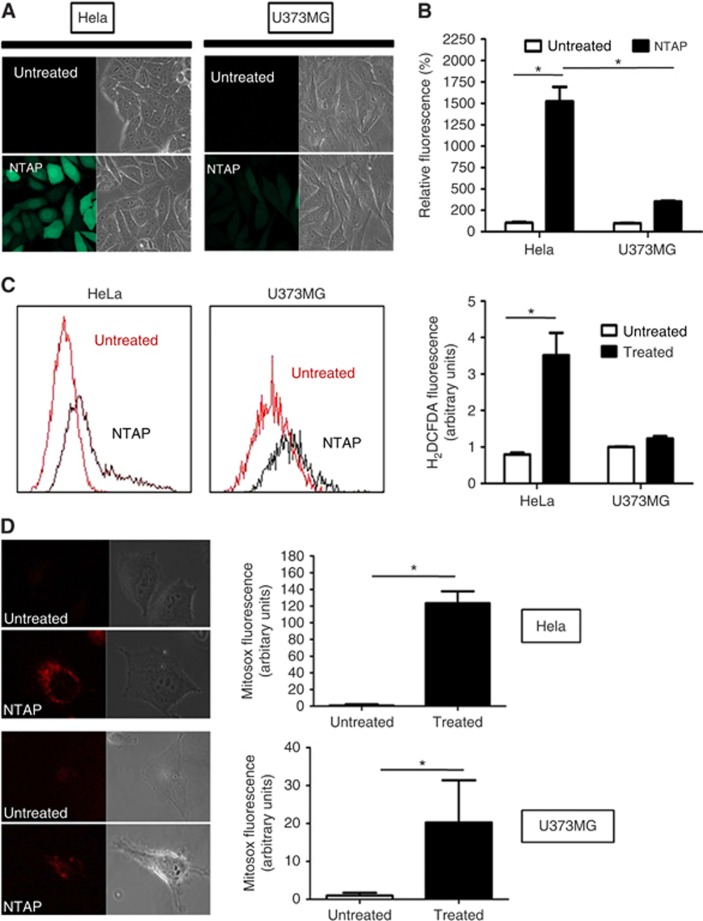
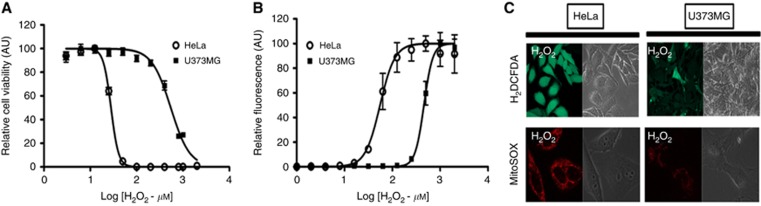
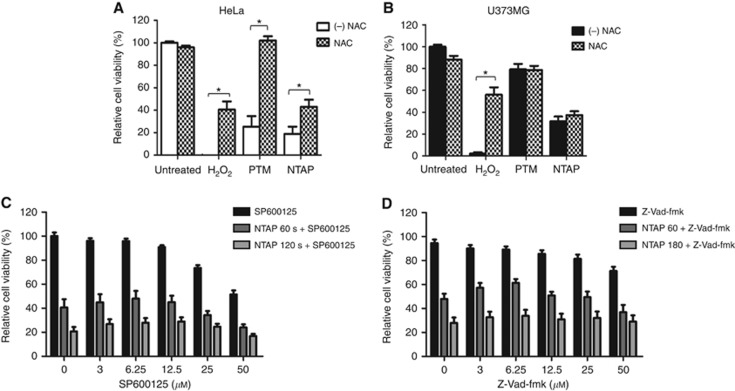
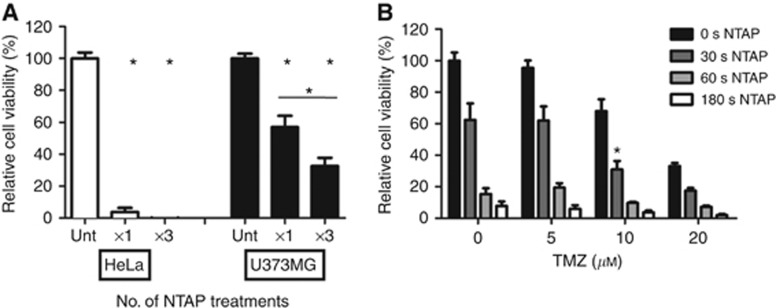
Results: Non-thermal atmospheric plasma decreased cell viability in a dose (time)-dependent manner. U373MG cells were shown to be resistant to NTAP treatment when compared with HeLa cells, and the levels of intracellular reactive oxygen species (ROS) quantified in U373MG cells were much lower than in HeLa cells following exposure to the plasma field. Reactive oxygen species inhibitor N-acetyl cysteine (NAC) only alleviated the cytotoxic effects in HeLa cells and not in the relatively NTAP-resistant cell line U373MG. Longer exposures to NTAP induced a cell death independent of ROS, JNK and caspases in U373MG. The relative resistance of U373MG cells to NTAP could be overcome when used in combination with low concentrations of the GBM chemotherapy TMZ or exposure to multiple doses.

Conclusions: For the very first time, we report that NTAP induces an ROS-, JNK- and caspase-independent mechanism of cell death in the U373MG GBM cell line that can be greatly enhanced when used in combination with low doses of TMZ. Further refinement of the technology may facilitate localised activation of cytotoxicity against GBM when used in combination with new and existing chemotherapeutic regimens.


Figures

Figure 1
Figure 1
NTAP dose-dependent cytotoxicity of HeLa and GBM cells. (A) Schematic of the DBD-NTAP set-up used in this study, and a photograph showing plasma generation which fluoresces in the presence of helium gas. (B) Both U373MG cells and HeLa cells were exposed to NTAP at 75 kV for up to 5 min. Forty-eight hours later, the cells were analysed using the Alamar Blue cell viability assay. All experiments were repeated a minimum of three times. Statistical analysis was carried out using non-linear regression analyses. (C) Both U373MG cells and HeLa cells were exposed to NTAP at 75 kV for up to 180 s. HeLa cells were trypsinised and counted using a haemocytometer 48 h post treatment. U373MG cells were analysed 96 h post treatment. All experiments were repeated a minimum of three times. Statistical analysis was carried out using non-linear regression analyses. (D) HeLa and U373MG cells were exposed to NTAP at 75 kV for 3 min. After a 48-h incubation period, cells were loaded with 1 μg ml−1 JC-1 dye and analysed by flow cytometry. Data shown depict apoptosis measured by quantitative shifts in the ΔΨm (red to green) fluorescence intensity ratio before and after H2O2 and NTAP expsoure. All experiments were repeated in triplicate. Statistical analysis was carried out using one-way ANOVA with Tukey's multiple comparison post-test (*P<0.05). A full colour version of this figure is available at the British Journal of Cancer journal online.
Figure 2
Figure 2
NTAP demonstrates an increase in ROS formation. (A) In situ verification of ROS production in both U373MG cells and HeLa cells was measured 1 h after NTAP exposure (75 kV for 180 s) by confocal microscopy using 10 μM H2DCFDA. (B) ROS fluorescence intensity was quantified spectrophotometrically, 1 h after NTAP exposure (75 kV for 180 s). All experiments were repeated in triplicate. Statistical analysis was carried out using one-way ANOVA with Tukey's multiple comparison post-test (*P<0.05). (C) ROS production in both U373MG and HeLa was also measured by flow cytometry using 0.1 μM H2DCFDA. Fluorescence was quantified using the mean H2DCFDA and compared with the untreated control (P<0.001). (D) In situ verification of mitochondiral ROS production in both U373MG cells and HeLa cells was measured 1 h after NTAP exposure (75 kV for 180 s) by confocal microscopy using 2 μM MitoSOX red. The level of fluorescence was quantified using the Image J software and compared with the untreated control. Statisical analysis was carried out using t-test with Mann–Whitney test post-test. A full colour version of this figure is available at the British Journal of Cancer journal online.
Figure 3
Figure 3
GBM cells demonstrate a higher antioxidant activity against H2O2. (A) Both U373MG cells and HeLa cells were treated with increasing concentrations of H2O2 (0–2 mM). After 48 h cells were analysed using the Alamar Blue assay. All experiments were repeated at least three times. Statistical analysis was carried out using non-linear regression analyses. (B) Both U373MG cells and HeLa cells were preloaded for 1 h with 10 μM H2DCFDA. H2DCFDA was removed and a dose-response analysis was performed using H2O2. The relative increase in fluroescence was determined 1 h after the addition of H2O2. Statistical analyses were carried out using non-linear regression analyses. All experiments were repeated minimum in triplicate. (C) In situ verification of ROS production in both U373MG cells and HeLa cells, which was measured 1 h after the addition of H2O2 by confocal microscopy using both 10 μM H2DCFDA and 2 μM MitoSOX red, is shown. A full colour version of this figure is available at the British Journal of Cancer journal online.
Figure 4
Figure 4
NTAP induces ROS-, JNK- and caspase-independent cytotoxicity in glioma cells. Both HeLa (A) and U373MG (B) cells were preloaded for 1 h with 4 mM NAC. Cells were then treated with H2O2 or exposed to NTAP. After 48 h, cell was analysed using the Alamar blue assay. Data shown were normalised to the untreated control and are shown as the % mean±s.e.m. (n=minimum 20). All experiments were repeated at least three times. Statistical analysis was carried out using one-way ANOVA with Tukey's multiple comparison post test (*P<0.05). (C) Following NTAP treamtent, cells were loaded with increasing concentrations of SB600125 (0–50 μM) inhibitor and incubated for 48 h. Cells were then analysed using Alamar blue cell viability assay. (D) U373MG cells were pretreated with increasing concentrations of zVAD-FMK for 1 h before NTAP treatment. Cells were then incubated for 48 h and analysed by Alamar blue. Data shown were normalised to the untreated control and are shown as the % mean±s.e.m. (n=minimum 20). All experiments were repeated at least three times.
Figure 5
Figure 5
Synergy observed between TMZ and NTAP. (A) The effects of multiple NTAP exposures were determined in both HeLa and U373MG. Cells were exposed three times within a 10-h period with a minimum 4 h between treatments. Forty-eight hours later, cells were then analysed using the Alamar blue assay. Results are shown as the mean±s.e.m. (n= minimum 24). Statistical analysis was carried out using one-way ANOVA with Tukey's multiple comparison post-test (*P<0.05 against untreated control). (B) Following NTAP treatment, cells were treated with low concentrations of TMZ. Cells were incubated for 6 days and analysed by Alamar blue assay. Data shown were normalised to the untreated control and are shown as the % mean±s.e.m. (n=minimum 20). Statistical analysis was carried out using two-way ANOVA with Bonferroni post test (*P<0.001). All experiments were repeated at least three times.

References

    1. Adamson C, Kanu OO, Mehta AI, Di C, Lin N, Mattox AK, Bigner DD (2009) Glioblastoma multiforme: a review of where we have been and where we are going. Expert Opin Investig Drugs 18: 1061–1083. - PubMed
    1. Ahn HJ, Kim KI, Hoan NN, Kim CH, Moon E, Choi KS, Yang SS, Lee J-S (2014) Targeting cancer cells with reactive oxygen and nitrogen species generated by atmospheric-pressure air plasma. PLoS One 9: e86173. - PMC - PubMed
    1. Ahn HJ, Kim KI, Kim G, Moon E, Yang SS, Lee J-S (2011) Atmospheric-pressure plasma jet induces apoptosis involving mitochondria via generation of free radicals. PLoS One 6: e28154. - PMC - PubMed
    1. Candolfi M, Curtin JF, Nichols WS, Muhammad AG, King GD, Pluhar GE, McNiel EA, Ohlfest JR, Freese AB, Moore PF, Lerner J, Lowenstein PR, Castro MG (2007) Intracranial glioblastoma models in preclinical neuro-oncology: neuropathological characterization and tumor progression. J Neurooncol 85: 133–148. - PMC - PubMed
    1. Carrabba G, Mukhopadhyay D, Guha A (2009) Aberrant signalling complexes in GBMs: prognostic and therapeutic implications. Glioblastoma: Molecular Mechanisms of Pathogenesis and Current Therapeutic Strategies. Springer Science and Business Media: New York, NY, USA, pp 95–130.

Publication types