Response to interferons and antibacterial innate immunity in the absence of tyrosine-phosphorylated STAT1
- PMID: 26882544
- PMCID: PMC4772975
- DOI: 10.15252/embr.201540726
Response to interferons and antibacterial innate immunity in the absence of tyrosine-phosphorylated STAT1
Abstract
Signal transducer and activator of transcription 1 (STAT1) plays a pivotal role in the innate immune system by directing the transcriptional response to interferons (IFNs). STAT1 is activated by Janus kinase (JAK)-mediated phosphorylation of Y701. To determine whether STAT1 contributes to cellular responses without this phosphorylation event, we generated mice with Y701 mutated to a phenylalanine (Stat1(Y701F)). We show that heterozygous mice do not exhibit a dominant-negative phenotype. Homozygous Stat1(Y701F) mice show a profound reduction in Stat1 expression, highlighting an important role for basal IFN-dependent signaling. The rapid transcriptional response to type I IFN (IFN-I) and type II IFN (IFNγ) was absent in Stat1(Y701F) cells. Intriguingly, STAT1Y701F suppresses the delayed expression of IFN-I-stimulated genes (ISG) observed in Stat1(-/-) cells, mediated by the STAT2/IRF9 complex. Thus, Stat1(Y701F) macrophages are more susceptible to Legionella pneumophila infection than Stat1(-/-) macrophages. Listeria monocytogenes grew less robustly in Stat1(Y701F) macrophages and mice compared to Stat1(-/-) counterparts, but STAT1Y701F is not sufficient to rescue the animals. Our studies are consistent with a potential contribution of Y701-unphosphorylated STAT1 to innate antibacterial immunity.
Keywords: STAT1; innate immunity; interferon; pathogen; phosphorylation.
© 2016 The Authors. Published under the terms of the CC BY 4.0 license.
Figures
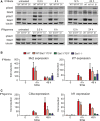
Western blot analysis of
STAT expression and phosphorylation. Bone marrow‐derived macrophages (BMDM s) of wild‐type (WT ), Stat1Y701F/+ (WT /YF ), or Stat1−/− (S1) mice were treated with 250IU /ml ofIFN β or 5 ng/ml ofIFN γ for 0.5, 6, 12, and 24 h. Whole‐cell extracts were collected and tested in Western blot for levels of phosphorylation ofSTAT 1 (Y701) andSTAT 2 (Y689) and total level ofSTAT 1 andSTAT 2. The blots are representative of more than three independent experiments.Effect of Stat1Y701F heterozygosity on the expression of type I
IFN ‐induced genes (ISG s).BMDM s of wild‐type (WT ), Stat1Y701F/+ (WT /YF ), or Stat1−/− (S1) mice were treated with 250IU /ml ofIFN β for 4 and 48 h. Gene expression was measured byqPCR and normalized to Gapdh and to the expression levels in untreated wild‐type cells. The bars represent mean values with the standard deviations (SD ) of three independent experiments.Effect of Stat1Y701F heterozygosity on the expression of
IFN β‐induced genes.BMDM s of wild‐type (WT ), Stat1Y701F/+ (WT /YF ), or Stat1−/− (S1) mice were treated with 5 ng/ml ofIFN γ for 4 and 48 h. Gene expression was measured byqPCR and normalized to Gapdh and to the expression levels in untreated wild‐type cells. The bars represent mean values with the standard deviations (SD ) of three independent experiments.

Effect of Stat1Y701F homozygosity on
STAT 1 expression in mouse cells and organs. Spleens, livers, or bone marrow‐derived macrophages (BMDM s) were isolated from wild‐type (WT ), Stat1Y701F (YF ), and Stat1−/− (S1) mice. Whole‐cell extracts were collected and tested for levels of total STAT1 in Western blot. The blots are representative of more than three independent experiments.Effect of Stat1Y701F homozygosity on
STAT 1 phosphorylation at Y701.BMDM s were isolated from wild‐type (WT ), Stat1Y701F (YF ), and Stat1−/− (S1) mice and stimulated for 30 min with 250IU /ml ofIFN β or 5 ng/ml ofIFN γ. Whole‐cell extracts were collected and tested for levels ofSTAT 1 phosphorylation on Y701 in Western blot. The blots are representative of more than three independent experiments.Effect of Stat1Y701F homozygosity on the expression of
IFN β‐induced genes.BMDM s of wild‐type (WT ), Stat1Y701F (YF ), and Stat1−/− (S1) mice were treated with 5 ng/ml ofIFN γ for 4 or 48 h. Gene expression was measured byqPCR and normalized to Gapdh and to the expression levels in untreated wild‐type cells. Bars represent a mean value of three independent experiments. Error bars represent standard error of the mean (SEM ); asterisks denote the level of statistical significance (ns, P > 0.05); and the P‐values were calculated using paired ratio t‐test.Effect of Stat1Y701F homozygosity on the expression of type I
IFN ‐induced genes (ISG s).BMDM s were isolated from wild‐type (WT ), Stat1Y701F, Stat1−/−, Stat2−/−, and Irf9−/− mice treated with 250IU /ml ofIFN β for 4, 8, 12, 24, or 48 h. Gene expression was measured byqPCR and normalized to Gapdh and to the expression levels in untreated wild‐type cells. Bars represent a mean value of three independent experiments. Error bars represent standard error of the mean (SEM ); asterisks denote the level of statistical significance (*P ≤ 0.05; **P ≤ 0.01); and the P‐values were calculated using paired ratio t‐test.STAT 1 andSTAT 2 phosphorylation in Stat1−/−, Stat1Y701F, Stat2−/−, and Irf9−/− macrophages.BMDM s were isolated from wild‐type (WT ), Stat1Y701F (YF ), Stat1−/− (S1), Stat2−/− (S2), and Irf9−/− (IRF 9) mice and treated with 250IU /ml ofIFN β for 30 min or 6, 12, or 24 h. Whole‐cell extracts were collected and tested in Western blot for levels of phosphorylation ofSTAT 1 on Y701 and ofSTAT 2 on Y689. The same cell extracts were tested for total levels ofSTAT 1 andSTAT 2. The blots are representative of more than three independent experiments.
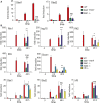
Expression of Stat1 and Stat2 genes. Bone marrow‐derived macrophages (
BMDM s) of wild‐type (WT ), Stat1Y701F, and Stat1−/− mice were treated with 5 ng/ml ofIFN γ (IFN g) for 4 or 48 h. Gene expression was measured byqPCR and normalized to Gapdh and to the expression levels in uninduced wild‐type cells.Expression of type I
IFN ‐induced genes.BMDM s of wild‐type (WT ), Stat1Y701F, Stat1−/−, Stat2−/−, and Irf9−/− mice were treated with 250IU /ml ofIFN β for 4 or 48 h. Gene expression was measured byqPCR and normalized to Gapdh and to the expression levels in uninduced wild‐type cells.


IFN β‐stimulated binding ofSTAT 2 toISRE sequences of Mx2 and Irf7 promoters. Bone marrow‐derived macrophages (BMDM s) of wild‐type (WT ), Stat1Y701F (YF ), Stat1−/− (S1), Stat2−/− (S2), and Irf9−/− (IRF 9) mice were treated with 250IU /ml ofIFN β for 2 or 24 h. Cells were cross‐linked, sonicated, and immunoprecipitated withSTAT 2‐specific antibody. The amount of precipitatedDNA was measured byqPCR . Bars represent a mean value of three independent experiments. Error bars represent standard error of the mean (SEM ); asterisks denote the level of statistical significance (**P ≤ 0.01); and the P‐values were calculated using paired ratio t‐test.Impact of
STAT 2 deficiency onIFN β‐stimulatedSTAT 1 association with the Mx2ISRE .BMDM s of wild‐type (WT ), Stat1−/− (S1), and Stat2−/− (S2) mice were treated with 250IU /ml ofIFN β for 2 or 24 h. Cells were cross‐linked, sonicated, and immunoprecipitated withSTAT 1‐specific antibody. The amount of precipitatedDNA was measured byqPCR . Bars represent mean values of three independent experiments; error bars represent standard error of the mean (SEM ).Simultaneous association of
STAT 1 andSTAT 2 with the Mx2ISRE analyzed by ChIP ‐reChIP .BMDM s of wild‐type (WT ) mice were treated with 250IU /ml ofIFN β for 2 or 24 h. Cells were cross‐linked, sonicated, and immunoprecipitated with eitherSTAT 1‐specific antibody and re‐immunoprecipitated withSTAT 2‐specific antibody or vice versa. The amount of precipitatedDNA was measured byqPCR . Bars represent mean values of three independent experiments; error bars represent standard deviation (SD ).Impact of
STAT 1Y701F on delayed,STAT 2‐mediated expression ofIFN ‐induced genes. Stat1−/− fibroblasts were transfected with plasmids driving expression of the indicated proteins. Twenty‐four hours after transfection, 250IU /ml ofIFN β was added to the transfected cells andISG expression was determined byqPCR after 48 h of cytokine treatment. Gene expression was measured byqPCR and normalized to Gapdh. Bars represent a mean value of three independent experiments. Error bars represent standard error of the mean (SEM ) and asterisks denote the level of statistical significance (*P ≤ 0.05); the P‐values were calculated using paired ratio t‐test.

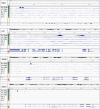
Analysis of
STAT 2 nuclear translocation by immunofluorescence. Bone marrow‐derived macrophages (BMDM s) of wild‐type (WT ), Stat1Y701F (YF ), Stat1−/− (S1), Stat2−/− (S2), and Irf9−/− (IRF 9) mice were seeded on cover slips and stimulated with 250IU /ml ofIFN β for 30 min or 24 h. The cells were fixed and stained forSTAT 2‐specific antibody followed by Alexa Fluor® 488 conjugated secondary antibody (green). Nuclei were stained withDAPI (blue). Studies are representative of more than three independent experiments. The scale bars represent 10 µm.Quantitative evaluation of
STAT 2 nuclear translocation. The intensity ofSTAT 2‐dependent immunofluorescence overDNA staining (DAPI ) was quantified using ImageJ software in 20 cells from two independent experiments. Bars represent a mean with standard deviation (SD ) and asterisks denote the level of statistical significance (***P ≤ 0.001); P‐value was calculated using unpaired t‐test.

Legionella pneumophila growth in unstimulated macrophages. Bone marrow‐derived macrophages (
BMDM s) of wild‐type (WT ), Stat1Y701F, and Stat1−/− mice were seeded in 24‐well plates and infected with Le. pneumophila (JR 32 Fla−,MOI 0.25). The numbers of colony‐forming units (CFU s) were determined 24, 48, and 72 h after infection on charcoal yeast extract plates (CYE ). The 0 time point was collected 1.5 h after the infection.Legionella pneumophila growth in
IFN β‐treated macrophages. Bone marrow‐derived macrophages (BMDM s) of wild‐type (WT ), Stat1Y701F, and Stat1−/− mice were seeded in 24‐well plates, treated with 500 U/ml ofIFN β, and then infected with Le. pneumophila (JR 32 Fla−,MOI 0.25). The numbers of colony‐forming units (CFU ) were determined 24, 48, and 72 h after infection on charcoal yeast extract plates (CYE ). The 0 time point was collected 1.5 h after the infection.

Western blot analysis of
STAT 1 tyrosine phosphorylation. Bone marrow‐derived macrophages (BMDM s) of wild‐type (WT ), Stat1Y701F (YF ), and Stat1−/− (S1) mice were infected with L. monocytogenes (LO 28,MOI 10) for 5 or 6 h. Whole‐cell extracts were collected and tested in Western blot for levels of totalSTAT 1 and phosphorylation ofSTAT 1 on tyrosine 701 (Y701). The blots are representative of more than three independent experiments.Impact of Stat1Y701F mutation, or of deletion of
ISGF 3 subunits on the expression of the Ifnb gene.BMDM s of wild‐type (WT ), Stat1Y701F, Stat1−/−, Stat2−/−, and Irf9−/− mice were infected with L. monocytogenes (LO 28,MOI 10) for 4, 8, 12, 24, or 48 h. Levels of Ifnb gene expression were determined byqPCR . Bars represent mean values of three independent experiments. Error bars represent standard error of the mean (SEM ).
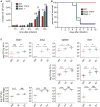
Impact of Stat1 deficiency or of
STAT 1Y701F mutation on the growth of Listeria monocytogenes in macrophages. Bone marrow‐derived macrophages (BMDM s) of wild‐type (WT ), Stat1Y701F, and Stat1−/− mice were infected with L. monocytogenes (LO 28,MOI 10). Colony‐forming unit (CFU ) numbers were determined 1, 2, 4, 6, or 8 h after infection by plating on brain–heart infusion (BHI ) agar plates. The graph represents biological triplicates and the data are represented as mean values. Error bars represent standard deviation (SD ) and asterisks denote statistically significant differences (ns, P > 0.05; **P ≤ 0.01; ***P ≤ 0.001); P‐values were calculated using unpaired t‐test.Survival of mice infected with L. monocytogenes. 10 wild‐type (
WT ), Stat1Y701F, and Stat1−/− mice per group were infected by intraperitoneal injection of 1 × 10² viable L. monocytogenes. Survival was monitored over 10 days. The study is representative of more than three independent experiments.Organ pathogen burdens of mice infected with L. monocytogenes. Wild‐type (
WT ), Stat1Y701F (YF ), and Stat1−/− (S1) mice were infected by intraperitoneal injection of 1 × 10² viable L. monocytogenes. Number of colony‐forming units (CFU ) in organs was determined at 48, 72 h, or at the terminal stage of infection by plating homogenates on brain–heart infusion (BHI ) agar plates or Oxford agar plates (for lungs). Dots represent pooled data of three independent experiments. Lines represent the median and asterisks denote statistically significant differences (ns, P > 0.05; *P ≤ 0.05; **P ≤ 0.01; ***P ≤ 0.001; ****P ≤ 0.0001); P‐values were calculated using Mann–Whitney U‐test.
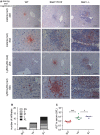
Immunohistochemical analysis of infection and inflammatory infiltrates. Wild‐type (
WT ), Stat1Y701F, and Stat1−/− mice were infected by intraperitoneal injection of 1 × 10² viable L. monocytogenes for 48 h. Liver sections were examined by immunohistochemistry with L. monocytogenes or Ly6C/Ly6G‐specific antibody. The scale bars on 20× magnification images represent 100 and 50 µm on the 63× magnification images.Quantitative evaluation of inflammatory infiltrates. Infiltrates representing the entire surface of sections from five animals per genotype were counted and categorized according to their size.
Liver pathology in infected mice. Wild‐type (
WT ), Stat1Y701F (YF ), and Stat1−/− (S1) mice were infected by intraperitoneal injection of 1 × 10⁵ viable L. monocytogenes for 72 h. Serum was collected and tested forALT activity. Lines represent the median and asterisks denote statistically significant differences (*P ≤ 0.05; ***P ≤ 0.001); P‐values were calculated using unpaired t‐test.

References
-
- Levy DE, Darnell JE Jr (2002) Stats: transcriptional control and biological impact. Nat Rev Mol Cell Biol 3: 651–662 - PubMed
Publication types
MeSH terms
Substances
LinkOut - more resources
Full Text Sources
Other Literature Sources
Medical
Molecular Biology Databases
Research Materials
Miscellaneous

