Randomized Controlled Trial
. 2016 Feb 16;18(1):21.
doi: 10.1186/s13058-016-0682-8.

Computational pathology of pre-treatment biopsies identifies lymphocyte density as a predictor of response to neoadjuvant chemotherapy in breast cancer

Affiliations
Randomized Controlled Trial

Computational pathology of pre-treatment biopsies identifies lymphocyte density as a predictor of response to neoadjuvant chemotherapy in breast cancer

H Raza Ali et al. Breast Cancer Res. .

Abstract

Background: There is a need to improve prediction of response to chemotherapy in breast cancer in order to improve clinical management and this may be achieved by harnessing computational metrics of tissue pathology. We investigated the association between quantitative image metrics derived from computational analysis of digital pathology slides and response to chemotherapy in women with breast cancer who received neoadjuvant chemotherapy.

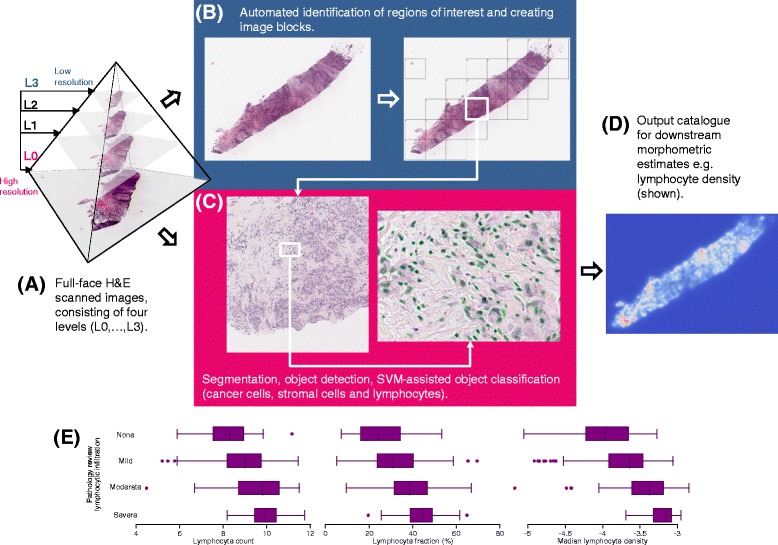
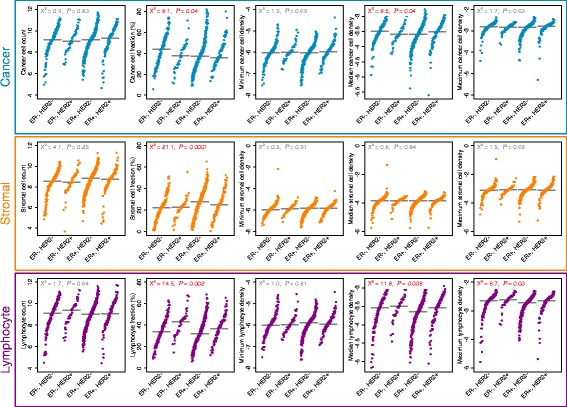
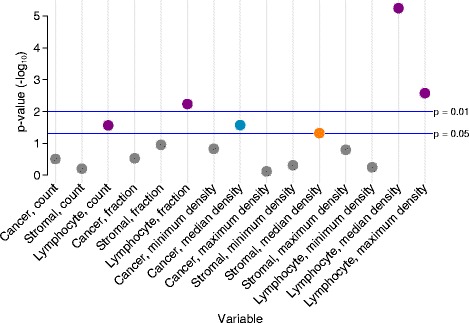
Methods: We digitised tissue sections of both diagnostic and surgical samples of breast tumours from 768 patients enrolled in the Neo-tAnGo randomized controlled trial. We subjected digital images to systematic analysis optimised for detection of single cells. Machine-learning methods were used to classify cells as cancer, stromal or lymphocyte and we computed estimates of absolute numbers, relative fractions and cell densities using these data. Pathological complete response (pCR), a histological indicator of chemotherapy response, was the primary endpoint. Fifteen image metrics were tested for their association with pCR using univariate and multivariate logistic regression.

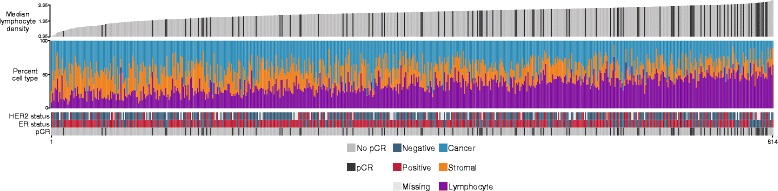
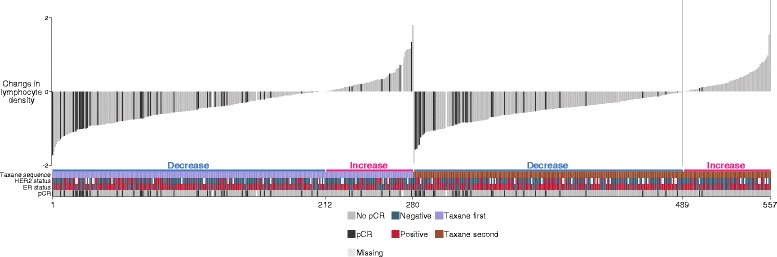
Results: Median lymphocyte density proved most strongly associated with pCR on univariate analysis (OR 4.46, 95 % CI 2.34-8.50, p < 0.0001; observations = 614) and on multivariate analysis (OR 2.42, 95 % CI 1.08-5.40, p = 0.03; observations = 406) after adjustment for clinical factors. Further exploratory analyses revealed that in approximately one quarter of cases there was an increase in lymphocyte density in the tumour removed at surgery compared to diagnostic biopsies. A reduction in lymphocyte density at surgery was strongly associated with pCR (OR 0.28, 95 % CI 0.17-0.47, p < 0.0001; observations = 553).

Conclusions: A data-driven analysis of computational pathology reveals lymphocyte density as an independent predictor of pCR. Paradoxically an increase in lymphocyte density, following exposure to chemotherapy, is associated with a lack of pCR. Computational pathology can provide objective, quantitative and reproducible tissue metrics and represents a viable means of outcome prediction in breast cancer.

Trial registration: ClinicalTrials.gov NCT00070278 ; 03/10/2003.


Figures

Fig. 1
Fig. 1
Overview of the image processing method. a Full-face H&E scanned images consist of four levels (L0–L3) across a gradation of resolutions. The levels L3 (lowest resolution) and L0 (highest resolution) are used to process each image. b Automated identification of regions of interest was performed by dividing image layer L3 into several small blocks (grid) and by analysing the pixel intensity distribution of each block. c Each image block found to contain tissue was mapped onto layer L0 and image segmentation and object detection (green ellipses) was conducted to construct an object catalogue. d Illustrative representation as a contour map of lymphocyte density derived using a k-nearest neighbour algorithm of the 50 nearest like-class neighbours. e Distribution of lymphocyte metrics by categories of lymphocytic infiltration based on central pathology review. SVM support vector machine
Fig. 2
Fig. 2
Distribution of pre-treatment sample image metrics by tumour molecular subtype. Horizontal grey lines represent median values. Results of the Kruskal-Wallis test are depicted within graphs; red text denotes p values <0.05. ER oestrogen receptor, HER2 human epidermal growth factor receptor 2
Fig. 3
Fig. 3
Association between image metrics and pathological complete response (pCR). Manhattan plot illustrates p values (–log10) from univariate logistic regression analyses testing the association between 15 image metrics and pCR
Fig. 4
Fig. 4
Relationship between median lymphocyte density, cellular composition, pathological complete response (pCR) and receptor status. Bar plots illustrating the relationship between pathological complete response, oestrogen receptor (ER) status, human epidermal growth factor receptor 2 (HER2) status, cellular composition and median lymphocyte density. Plots are sorted by increasing level of median lymphocyte density. For illustration, median lymphocyte density has been rescaled to positive values
Fig. 5
Fig. 5
Change in lymphocyte density and association with pathological complete response (pCR). Plot depicts the change in median lymphocyte density between paired pre-treatment and post-treatment surgical samples. The primary sort key is taxane sequence and the secondary sort key is change in lymphocyte density. Annotated rug depicts oestrogen receptor (ER), human epidermal growth factor receptor 2 (HER2) status and taxane sequence for samples corresponding to those depicted in the plot above

Similar articles

Cited by

References

    1. Killelea BK, Yang VQ, Mougalian S, Horowitz NR, Pusztai L, Chagpar AB, et al. Neoadjuvant chemotherapy for breast cancer increases the rate of breast conservation: results from the National Cancer Database. J Am Coll Surg. 2015;220(6):1063–9. doi: 10.1016/j.jamcollsurg.2015.02.011. - DOI - PubMed
    1. Cortazar P, Zhang L, Untch M, Mehta K, Costantino JP, Wolmark N, et al. Pathological complete response and long-term clinical benefit in breast cancer: the CTNeoBC pooled analysis. Lancet. 2014;384(9938):164–72. doi: 10.1016/S0140-6736(13)62422-8. - DOI - PubMed
    1. Berruti A, Amoroso V, Gallo F, Bertaglia V, Simoncini E, Pedersini R, et al. Pathologic complete response as a potential surrogate for the clinical outcome in patients with breast cancer after neoadjuvant therapy: a meta-regression of 29 randomized prospective studies. J Clin Oncol. 2014;32(34):3883–91. doi: 10.1200/JCO.2014.55.2836. - DOI - PubMed
    1. Houssami N, Macaskill P, von Minckwitz G, Marinovich ML, Mamounas E. Meta-analysis of the association of breast cancer subtype and pathologic complete response to neoadjuvant chemotherapy. Eur J Cancer. 2012;48(18):3342–54. doi: 10.1016/j.ejca.2012.05.023. - DOI - PubMed
    1. Hatzis C, Pusztai L, Valero V, Booser DJ, Esserman L, Lluch A, et al. A genomic predictor of response and survival following taxane-anthracycline chemotherapy for invasive breast cancer. JAMA. 2011;305(18):1873–81. doi: 10.1001/jama.2011.593. - DOI - PMC - PubMed

Publication types

Associated data