. 2016 Jun;33(6):1381-95.
doi: 10.1093/molbev/msw036. Epub 2016 Feb 15.

R2d2 Drives Selfish Sweeps in the House Mouse

Affiliations

R2d2 Drives Selfish Sweeps in the House Mouse

John P Didion et al. Mol Biol Evol. 2016 Jun.

Abstract

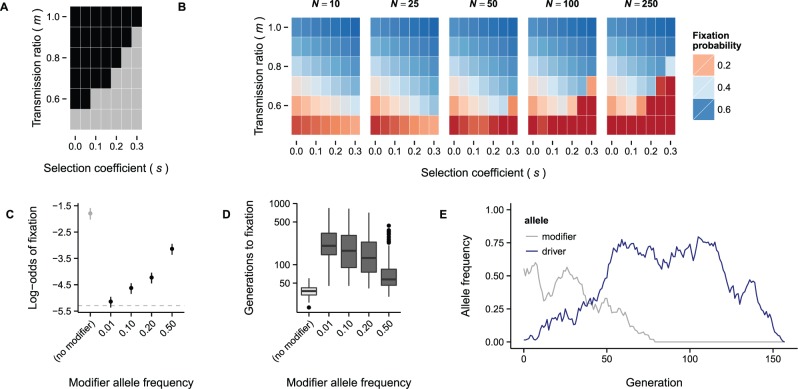
A selective sweep is the result of strong positive selection driving newly occurring or standing genetic variants to fixation, and can dramatically alter the pattern and distribution of allelic diversity in a population. Population-level sequencing data have enabled discoveries of selective sweeps associated with genes involved in recent adaptations in many species. In contrast, much debate but little evidence addresses whether "selfish" genes are capable of fixation-thereby leaving signatures identical to classical selective sweeps-despite being neutral or deleterious to organismal fitness. We previously described R2d2, a large copy-number variant that causes nonrandom segregation of mouse Chromosome 2 in females due to meiotic drive. Here we show population-genetic data consistent with a selfish sweep driven by alleles of R2d2 with high copy number (R2d2(HC)) in natural populations. We replicate this finding in multiple closed breeding populations from six outbred backgrounds segregating for R2d2 alleles. We find that R2d2(HC) rapidly increases in frequency, and in most cases becomes fixed in significantly fewer generations than can be explained by genetic drift. R2d2(HC) is also associated with significantly reduced litter sizes in heterozygous mothers, making it a true selfish allele. Our data provide direct evidence of populations actively undergoing selfish sweeps, and demonstrate that meiotic drive can rapidly alter the genomic landscape in favor of mutations with neutral or even negative effects on overall Darwinian fitness. Further study will reveal the incidence of selfish sweeps, and will elucidate the relative contributions of selfish genes, adaptation and genetic drift to evolution.

Keywords: House Mouse.; Meiotic Drive; R2d2; Selective Sweep; Selfish Genes.


Figures

F<sc>ig</sc>. 1.
Fig. 1.
Wild mouse populations used in this study. (A) Geographic distribution of samples used in this study. Samples are colored by taxonomic origin: Blue for Mus musculus domesticus, green for Mus musculus castaneus. Those with standard karyotype (2n = 40) are indicated by closed circles; samples with Robertsonian fusion karyotypes (2n < 40) are indicated by open circles. Populations from Floreana Island (Galapagos Islands, Ecuador; “EC”), Farallon Island (off the coast of San Francisco, California, United States; “USW”), and Maryland, United States (“USE”) are not shown. (B, C) MDS (k = 3 dimensions) reveals population stratification consistent with geography. Mus musculus domesticus populations are labeled by country of origin. Outgroup samples of M. m. castaneus origin cluster together (cas). (D) Population graph estimated from autosomal allele frequencies by TreeMix. Black edges indicate ancestry, while colored edges indicate gene flow by migration or admixture (with yellow to red indicating increasing probability of migration). Topography of the population graph is consistent with MDS result and with the geographic origins of the samples.
F<sc>ig</sc>. 2.
Fig. 2.
Haplotype sharing at R2d2 provides evidence of a selective sweep in wild mice of European origin. (A) Weighted haplotype-sharing score (supplementary methods, Supplementary Material online) computed in 500 kb bins across autosomes, within which individuals are drawn from the same population (lower panel) or different populations (upper panel). Peaks of interest overlay R2d2 (Chromosome 2; see supplementary fig. S2, Supplementary Material online, for zoomed-in view) and Vkorc1 (distal Chromosome 7). The position of the closely linked t-haplotype and MHC loci is also marked. (B) Decay of EHH (Sabeti et al. 2002) on the R2d2HC-associated (blue) versus the R2d2LC-associated (red) haplotype. EHH is measured outward from the index SNP at chr2:83,790,275 and is bounded between 0 and 1. (C) Haplotype bifurcation diagrams for the R2d2HC (top panel, blue) and R2d2LC (bottom panel, red) haplotypes at the index SNP (open circle). Darker colors and thicker lines indicate higher haplotype frequencies. Haplotypes extend 100 sites in each direction from the index SNP.
F<sc>ig</sc>. 3.
Fig. 3.
An R2d2HC allele rises to high frequency despite negative effect on litter size in the DO. (A) R2d2 drives 3-fold increase in WSB/EiJ allele frequency in 13 generations in the DO population. Circle sizes reflect number of chromosomes genotyped (2N); error bars are ±2 standard error. (B) Allele frequencies across Chromosome 2 (averaged in 1 Mb bins) at generation 13 of the DO, classified by founder strain. Gray shaded region is the candidate interval for R2d2. (C) Mean litter size among DO females according to R2d2 genotype: LL, R2d2LC/LC; LH − TRD, R2d2LC/HC without transmission ratio distortion; LH + TRD, R2d2LC/HC with transmission ratio distortion; HH, R2d2HC/HC. Circle sizes reflect number of females tested; error bars are 95% confidence intervals from a linear mixed model which accounts for parity and repeated measures on the same female (supplementary methods, Supplementary Material online.) (D) Mean absolute number of R2d2HC alleles transmitted in each litter by heterozygous females with (LL + TRD) or without (LL − TRD) transmission ratio distortion. LL + TRD females transmit more R2d2HC alleles despite their significantly reduced litter size.
F<sc>ig</sc>. 4.
Fig. 4.
R2d2HC alleles rapidly increase in frequency in ICR:Hsd-derived laboratory populations. (A) R2d2HC allele frequency during breeding of four HR selection lines and four control lines. Trajectories are colored by their fate: Blue, R2d2HC fixed by generation 20; red, R2d2HC fixed by generation 60; gray, R2d2HC not fixed. Circle sizes reflect number of chromosomes (2N) genotyped. (B) Cumulative distribution of time to fixation (blue) or loss (gray) of the focal allele in 1,000 simulations of an intercross line mimicking the HR breeding scheme. Dotted line indicates median fixation time. (C) R2d2HC allele frequency during breeding of an (HR8xC57BL/6J) advanced intercross line. Circle sizes reflect number of chromosomes (2N) genotyped. (D) Cumulative distribution of time to fixation (blue) or loss (gray) of the focal allele in 1,000 simulations of an advanced intercross line mimicking the HR8xC57BL/6J advanced intercross line (AIL). Dotted line indicates median fixation time.
F<sc>ig</sc>. 5.
Fig. 5.
Population dynamics of a meiotic drive allele. (A) Phase diagram for a meiotic drive system like R2d2 with respect to transmission ratio (m) and selection coefficient against the heterozygote (s). Regions of the parameter space for which there is directional selection for the driving allele are shown in black; regions in which there are unstable equilibria or directional selection against the driving allele are shown in gray. (B) Probability of fixing the driving allele as a function of m, s, and population size (N). Notice that, in the area corresponding to the gray region of panel A, fixation probability declines rapidly as population size increases. (C) Probability of fixing the driving allele in simulations of meiotic drive dependent on no modifier (light gray) or a single modifier locus (dark gray) with varying allele frequency; N = 100, s = 0.2, maximum m = 0.8, initial driver frequency = 1/2N. Estimates are given ± 2 standard error. Gray dashed line corresponds to fixation probability for a neutral allele (1/2N). (D) Time to fixation of the driving allele. Values represent 100 fixation events in each condition. (E) Example of allele-frequency trajectories from a “collapsed” selfish sweep. Although the modifier allele is present at intermediate frequency, the driving allele sweeps to a frequency of ∼0.75. After the modifier allele is lost, the driver drifts out of the population as well.

References

    1. Albrechtsen A, Moltke I, Nielsen R. 2010. Natural selection and the distribution of identity-by-descent in the human genome. Genetics 186:295–308. - PMC - PubMed
    1. Babcock CS, Anderson WW. 1996. Molecular evolution of the Sex-Ratio inversion complex in Drosophila pseudoobscura: analysis of the Esterase-5 gene region. Mol Biol Evol. 13:297–308. - PubMed
    1. Bersaglieri T, Sabeti PC, Patterson N, Vanderploeg T, Schaffner SF, Drake JA, Rhodes M, Reich DE, Hirschhorn JN. 2004. Genetic signatures of strong recent positive selection at the lactase gene. Am J Hum Genet. 74:1111–1120. - PMC - PubMed
    1. Brandvain Y, Coop G. 2011. Scrambling eggs: meiotic drive and the evolution of female recombination rates. Genetics 190:709–723. - PMC - PubMed
    1. Browning BL, Browning SR. 2013. Improving the accuracy and efficiency of identity-by-descent detection in population data. Genetics 194:459–471. - PMC - PubMed

Publication types