. 2016 Mar 22;7(12):14458-75.
doi: 10.18632/oncotarget.7363.

Inhibition of WIP1 phosphatase sensitizes breast cancer cells to genotoxic stress and to MDM2 antagonist nutlin-3

Affiliations

Inhibition of WIP1 phosphatase sensitizes breast cancer cells to genotoxic stress and to MDM2 antagonist nutlin-3

Sona Pechackova et al. Oncotarget. .

Abstract

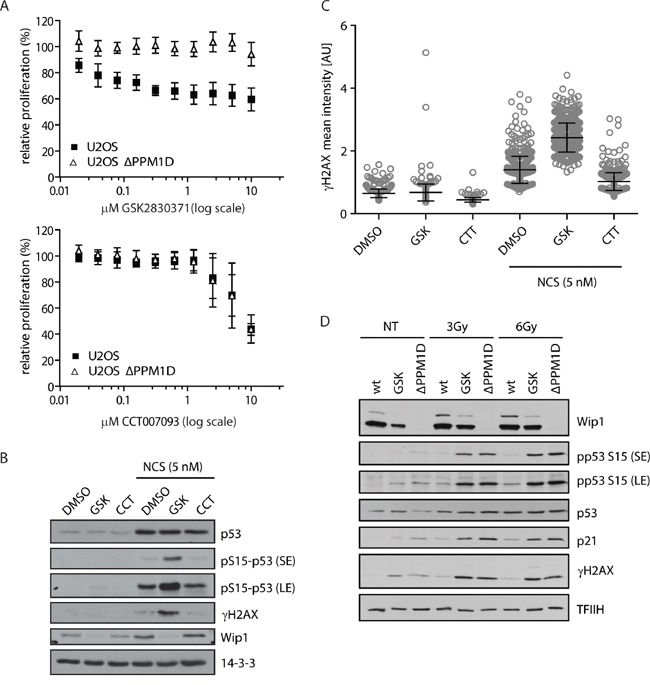
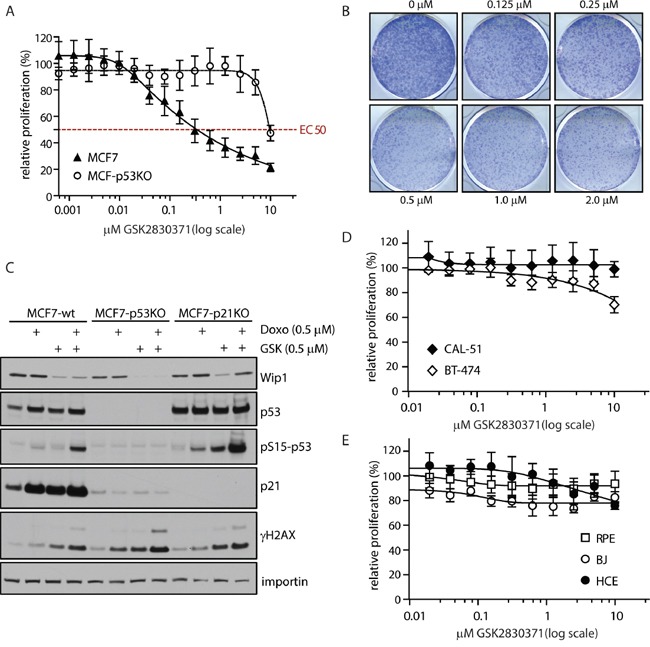
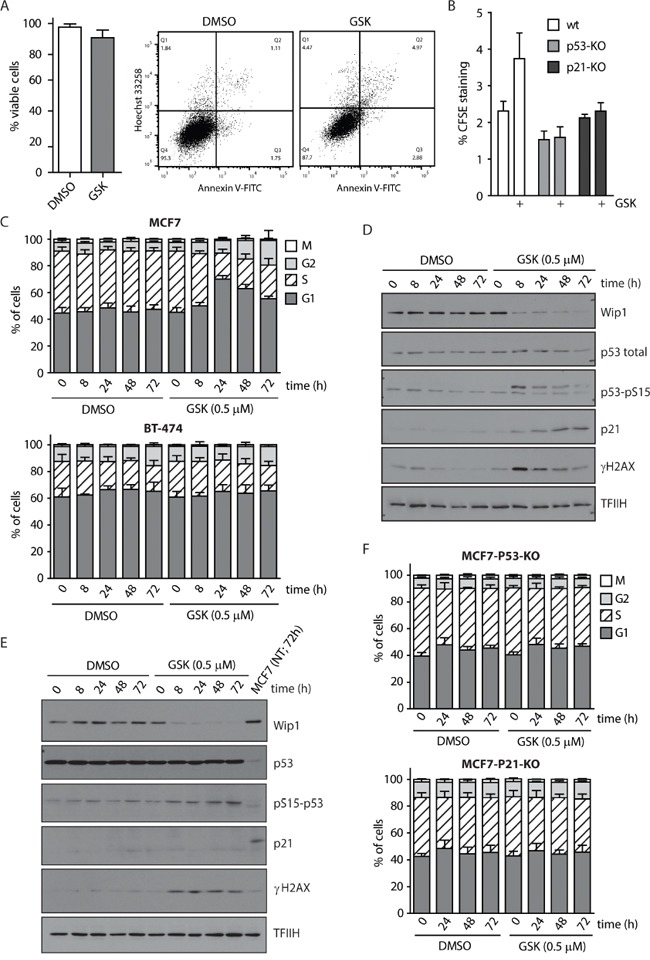
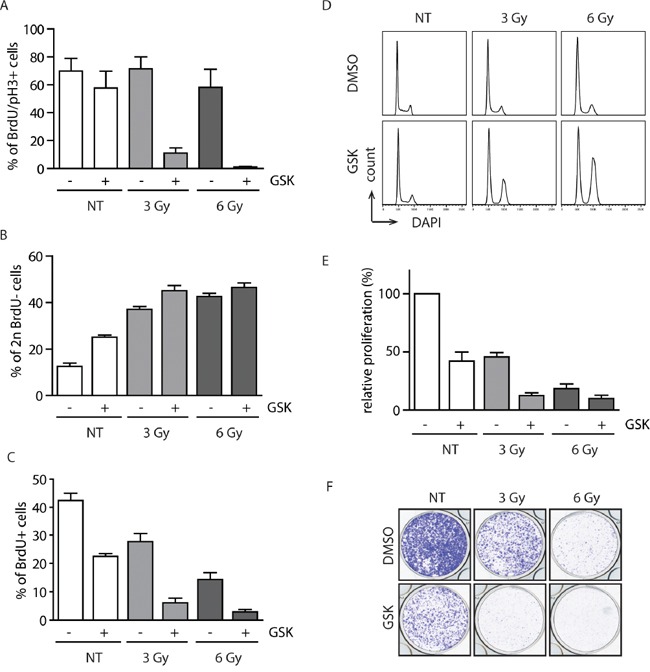
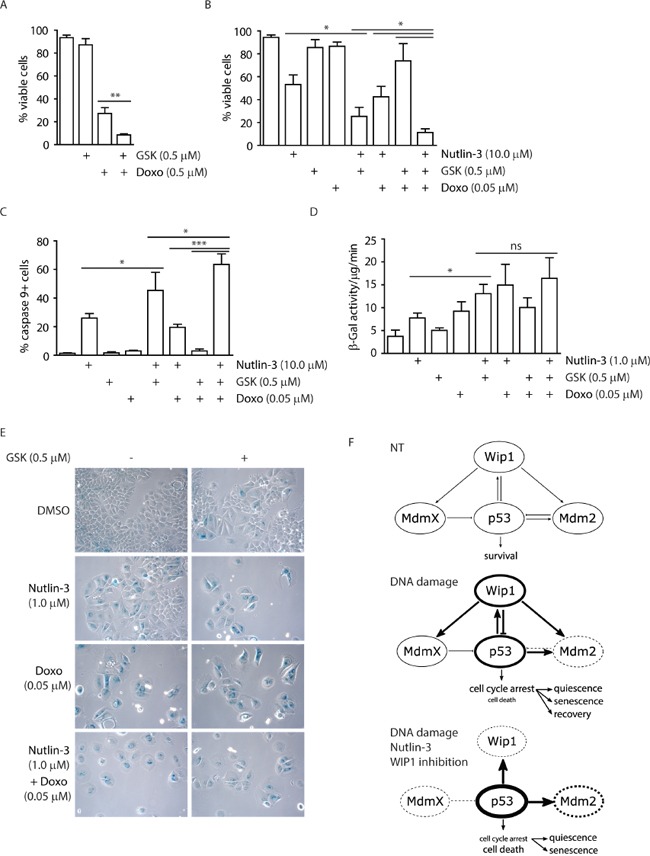
PP2C family serine/threonine phosphatase WIP1 acts as a negative regulator of the tumor suppressor p53 and is implicated in silencing of cellular responses to genotoxic stress. Chromosomal locus 17q23 carrying the PPM1D (coding for WIP1) is commonly amplified in breast carcinomas and WIP1 was proposed as potential pharmacological target. Here we employed a cellular model with knocked out PPM1D to validate the specificity and efficiency of GSK2830371, novel small molecule inhibitor of WIP1. We have found that GSK2830371 increased activation of the DNA damage response pathway to a comparable level as the loss of PPM1D. In addition, GSK2830371 did not affect proliferation of cells lacking PPM1D but significantly supressed proliferation of breast cancer cells with amplified PPM1D. Over time cells treated with GSK2830371 accumulated in G1 and G2 phases of the cell cycle in a p21-dependent manner and were prone to induction of senescence by a low dose of MDM2 antagonist nutlin-3. In addition, combined treatment with GSK2830371 and doxorubicin or nutlin-3 potentiated cell death through a strong induction of p53 pathway and activation of caspase 9. We conclude that efficient inhibition of WIP1 by GSK2830371 sensitizes breast cancer cells with amplified PPM1D and wild type p53 to chemotherapy.

Keywords: WIP1 inhibitor; breast cancer; checkpoint; nutlin-3; p53.


Conflict of interest statement

CONFLICTS OF INTEREST

The authors declare no conflicts of interest.

Figures

Figure 1
Figure 1. Validation of WIP1 inhibitors in U2OS-PPM1D-KO cells
A. U2OS or U2OS-PPM1D-KO cells were treated with DMSO, CCT007093 or GSK2830371 at indicated doses and relative cell proliferation was measured after 7 days. Error bars represent SD. B, C. U2OS cells were treated with DMSO, CCT007093 (10 μM, CCT) or GSK2830371 (0.5 μM, GSK) and DNA damage was induced by 5 nM neocarzinostatin (NCS) for 5 h. Cells were analyzed by immunoblotting (B) or fixed and nuclear γH2AX intensity was determined by immunofluorescent staining and microscopy analysis C. Dots represent individual cells. Error bars represent SD. D. U2OS or U2OS-PPM1D-KO (ΔPPM1D) cells were treated with DMSO or GSK2830371 (0.5 μM), exposed to ionizing radiation (3 and 6 Gy) and analysed by immunoblotting using indicated antibodies. Short exposure (SE) or long exposure (LE) is shown.
Figure 2
Figure 2. Inhibition of WIP1 impairs proliferation of cancer cells with amplified PPM1D
A. MCF7 or MCF7-P53-KO cells were treated with indicated doses of GSK2830371 and relative cell proliferation was measured after 7 days. Error bars represent SD. B. MCF7 cells were treated with indicated doses of GSK2830371 and cell proliferation was determined by colony formation assay after 7 days. Representative image from three independent experiments is shown. C. MCF7, MCF7-P53-KO or MCF7-P21-KO cells were treated with DMSO, GSK2830371 (0.5 μM), doxorubicin (0.5 μM) or combination of both and cells were analyzed by immunoblotting after 24 h. D. BT-474 or CAL-51 cells were treated with indicated doses of GSK2830371 and relative cell proliferation was measured after 7 days. Error bars represent SD. E. BJ fibroblasts, hTERT-RPE1 cells or human colon epithelia cells (HCE) were treated with indicated doses of GSK2830371 and relative cell proliferation was measured after 7 days. Error bars represent SD.
Figure 3
Figure 3. WIP1 inhibition leads to G1 and G2 phase accumulation in MCF7 cells
A. MCF7 cells were treated with DMSO or GSK2830371 (0.5 μM) for 5 days and percentage of living cells (Hoechst/Annexin V negative) was determined by flow cytometry. Error bars represent SD. B. MCF7, MCF7-P53-KO or MCF7-P21-KO cells were incubated with CFSE and subsequently treated with DMSO or GSK2830371 (0.5 μM) for 3 days. Fluorescent signal of CFSE was measured by flow cytometry. Plotted is the CFSE signal relative to the signal measured at day 0. Error bars represent SD. C. MCF7 or BT-474 cells were treated with DMSO or GSK2830371 (0.5 μM) for indicated times, pulsed with BrdU before fixation and distribution of cell cycle phases was determined by flow cytometry. BrdU incorporation was used as a marker of replication and pS10-H3 as a marker of mitotic cells. Error bars represent SD. D. MCF7 cells were treated as in C and analyzed by immunoblotting. E. BT-474 cells were treated as in C and analyzed by immunoblotting. F. MCF7-P53-KO or MCF7-P21-KO cells were treated with DMSO or GSK2830371 (0.5 μM) for indicated times, pulsed with BrdU before fixation and distribution of cell cycle phases was determined as in C. Error bars represent SD.
Figure 4
Figure 4. Inhibition of WIP1 potentiates the checkpoint through activation of the p53 pathway
A. MCF7 cells were pulsed with BrdU, treated with DMSO or GSK2830371 (0.5 μM) and exposed to IR. Cells were incubated in the presence of nocodazole and collected after 20 h. Fraction of BrdU positive cells that progressed to mitosis (pH3 marker) was determined by flow cytometry. Error bars represent SD. B. MCF7 cells were treated as in A. Fraction of BrdU negative cells with 2n DNA content (corresponding to G1) was determined by flow cytometry 20 h after treatment. Error bars represent SD. C, D. MCF7 cells were treated with DMSO or GSK2830371 (0.5 μM), exposed to IR and BrdU incorporation (C) or cell cycle profile (D) was determined after 3 days. Error bars represent SD. E. MCF7 cells were treated with DMSO or GSK2830371 (0.5 μM), exposed to IR and cell proliferation was analyzed after 6 days. Error bars represent SD. F. MCF7 cells were treated as in E and cell proliferation was determined by colony formation assay after 6 days. Representative image from three independent experiments is shown.
Figure 5
Figure 5. Inhibition of WIP1 increases sensitivity of cells to DNA damage and to nutlin-3
A. MCF7 cells were incubated with indicated doses of doxorubicin in combination with DMSO or GSK2830371 and relative fraction of proliferating cells was determined after 3 days. Error bars represent SD. B. MCF7 cells were incubated as in A and analysed by immunoblotting. Staining for TFIIH was used as loading control. Asterisk indicates an unspecific reactivity band. Short exposure (SE) or long exposure (LE) is shown. C. MCF7 cells were incubated with indicated doses of nutlin-3 in combination with DMSO or GSK2830371 and relative fraction of proliferating cells was determined after 3 days. Error bars represent SD. D. MCF7 cells were incubated with indicated doses of nutlin-3 and GSK2830371 for 1 day and analysed by immunoblotting. Staining for TFIIH was used as loading control. Asterisk indicates an unspecific reactivity band. Short exposure (SE) or long exposure (LE) is shown. E. MCF7 cells were incubated for 3 days with indicated doses of doxorubicin, nutlin-3 and GSK2830371 and fraction of proliferating cells was determined by cell survival assay (top) or by incorporation of BrdU (bottom). Error bars represent SD. F. ZR-75-1 cells were incubated for 6 days with indicated doses of doxorubicin, nutlin-3 and GSK2830371 and fraction of proliferating cells was determined by cell proliferation assay (top) or by incorporation of BrdU (bottom). Error bars represent SD. G. MCF7-P53-KO cells were incubated with indicated doses of doxorubicin, nutlin-3 and GSK2830371 and relative fraction of proliferating cells was determined after 3 days. Error bars represent SD. H. BT-474 cells were incubated with indicated doses of doxorubicin, nutlin-3 and GSK2830371 and relative fraction of proliferating cells was determined after 6 days. Error bars represent SD.
Figure 6
Figure 6. Inhibition of WIP1 increases transcription of p53 target genes
A. MCF7 cells were incubated for 3 days with indicated doses of doxorubicin, nutlin-3 and GSK2830371 and expression of indicated genes was determined by qRT-PCR. Levels are presented as the ratio of mRNA to GAPDH mRNA and are normalized to untreated cells. Error bars correspond to SEM. B. MCF7 cells were incubated as in A and expression of selected proteins was analysed by immunoblotting.
Figure 7
Figure 7. Inhibition of WIP1 potentiates induction of senescence or apoptosis
A. MCF7 cells were incubated with GSK2830371 (0.5 μM) and doxorubicin (0.5 μM) for 3 days and fraction of viable cells (Hoechst/Annexin V negative) was determined by flow cytometry. Error bars represent SD. B. MCF7 cells were incubated with indicated combinations of GSK2830371 (0.5 μM), nutlin-3 (10.0 μM) and doxorubicin (0.05 μM) for 3 days and fraction of viable cells (Hoechst/Annexin V negative) was determined by flow cytometry. Error bars represent SD. C. MCF7 cells were treated as in (B) and fraction of cells with active caspase 9 was determined by flow cytometry. Error bars represent SD. D. MCF7 cells were incubated with indicated combinations of GSK2830371, nutlin-3 (1.0 μM) and doxorubicin (0.05 μM) for 7 days. Activity of SA-β-galactosidase was measured in cell extracts using fluorimetric assay. Error bars represent SD. E. MCF7 cells were incubated as in D and SA-β-galactosidase activity was evaluated by light microscopy. F. Model for outcomes of treatment with p53/mdm2/Wip1 pathway modulators. Under non-treated conditions, p53 activity is tightly controlled by MDM2 and MDMX. Upon mild DNA damage, MDM2 is inhibited and destabilized leading to stabilization of p53 that in turn leads to increased transcription of its targets including WIP1 phosphatase. Subsequently WIP1 inactivates p53 pathway by direct dephosphorylation of p53 Ser15 and through activation of MDM2 and possibly also MDMX by their dephosphorylation. When MDM2-p53 interaction inhibitor nutlin-3 and WIP1 inhibitor are combined with DNA damage, MDM2 cannot ubiquitinate and thus degrade p53 and WIP1 cannot oppose activation of p53. This leads to further increase of p53 protein levels and its phosphorylation at Ser15 and results mainly in cell death. Thickness of the circle lines represents protein levels; dashed lines mean inhibition of the protein activity.

Similar articles

Cited by

References

    1. Jackson SP, Bartek J. The DNA-damage response in human biology and disease. Nature. 2009;461:1071–1078. - PMC - PubMed
    1. Halazonetis TD, Gorgoulis VG, Bartek J. An Oncogene-Induced DNA Damage Model for Cancer Development. Science. 2008;319:1352–1355. - PubMed
    1. Leontieva O, Gudkov A, Blagosklonny M. Weak p53 permits senescence during cell cycle arrest. Cell Cycle. 2010;9:4323–7. - PubMed
    1. Kracikova M, Akiri G, George A, Sachidanandam R, Aaronson SA. A threshold mechanism mediates p53 cell fate decision between growth arrest and apoptosis. Cell Death and Differentiation. 2013;20:576–588. - PMC - PubMed
    1. Zhang X-P, Liu F, Cheng Z, Wang W. Cell fate decision mediated by p53 pulses. Proceedings of the National Academy of Sciences of the United States of America. 2009;106:12245–12250. - PMC - PubMed

MeSH terms