. 2016 Feb 15;30(4):434-46.
doi: 10.1101/gad.273128.115.

A MED13-dependent skeletal muscle gene program controls systemic glucose homeostasis and hepatic metabolism

Affiliations

A MED13-dependent skeletal muscle gene program controls systemic glucose homeostasis and hepatic metabolism

Leonela Amoasii et al. Genes Dev. .

Abstract

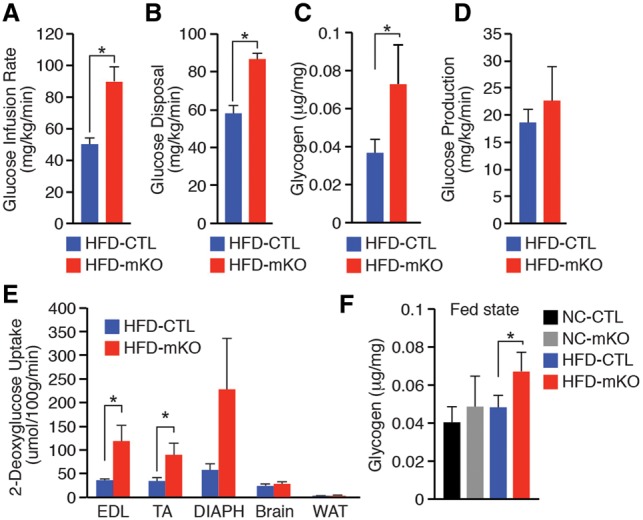
The Mediator complex governs gene expression by linking upstream signaling pathways with the basal transcriptional machinery. However, how individual Mediator subunits may function in different tissues remains to be investigated. Through skeletal muscle-specific deletion of the Mediator subunit MED13 in mice, we discovered a gene regulatory mechanism by which skeletal muscle modulates the response of the liver to a high-fat diet. Skeletal muscle-specific deletion of MED13 in mice conferred resistance to hepatic steatosis by activating a metabolic gene program that enhances muscle glucose uptake and storage as glycogen. The consequent insulin-sensitizing effect within skeletal muscle lowered systemic glucose and insulin levels independently of weight gain and adiposity and prevented hepatic lipid accumulation. MED13 suppressed the expression of genes involved in glucose uptake and metabolism in skeletal muscle by inhibiting the nuclear receptor NURR1 and the MEF2 transcription factor. These findings reveal a fundamental molecular mechanism for the governance of glucose metabolism and the control of hepatic lipid accumulation by skeletal muscle. Intriguingly, MED13 exerts opposing metabolic actions in skeletal muscle and the heart, highlighting the customized, tissue-specific functions of the Mediator complex.

Keywords: NURR1/NR4A2; glucose homeostasis; mediator complex; skeletal muscle.


Figures

Figure 1.
Figure 1.
Glucose tolerance and insulin sensitivity of MED13-mKO and CTL mice. (A) Body weights of mice on a HFD for 12 wk. (B) Body composition of mice measured by nuclear magnetic resonance (NMR) after 12 wk on a HFD. (C) Glucose tolerance test measured after 8 wk on a HFD. n = 10. (D) Insulin tolerance test measured after 10 wk on a HFD. n = 10. (E) Serum nonessential fatty acid levels (NEFA) after 12 wk on a HFD in a post-pandrial state. (F) Serum glucose levels after 12 wk on a HFD in a fasted state. (G) Serum insulin levels after 12 wk on a HFD in a post-pandrial state. Data are represented as mean ± SEM. n = 16 for a HFD for all experiments unless otherwise stated. (*) P < 0.05; (**) P < 0.005.
Figure 2.
Figure 2.
MED13-mKO mice are protected from HFD-induced hepatic steatosis. (A) H&E and lipid (Oil Red O) stain of liver tissue from mice on a HFD for 12 wk. Bar, 50 µm. (B) Liver TG levels. (C) Real-time quantitative RT–PCR (qRT–PCR) of genes involved in fatty acid transport (CD36/FATP) and synthesis (Fsp27) in liver tissue. (D) Real-time qRT–PCR of genes involved in fatty acid biosynthesis (stearoyl-CoA destaurase [Scd1], fatty acid synthase [Fas], elongation of long chain fatty acid family member [Elovl6], and acetyl-CoA carboxylase α [Acaca]), cholesterol synthesis (HMG-CoA-synthase [HCoASynt], HMG-CoA-reductase [HCoARed], and proprotein convertase subtilisin/kexin type 9 [Pcsk9]), and gluconeogenesis (glucose 6-phosphatase c [G6Pc], glucose 6-phosphatase d [G6Pd], and liver-type pyruvate kinase [Lpk]) and sterol regulatory element-binding transcription factor 1c (SREBP1c) in liver tissue. Data are represented as mean ± SEM. n = 10 for all experiments unless otherwise stated. (*) P < 0.05; (**) P < 0.005; (***) P < 0.0005.
Figure 3.
Figure 3.
MED13-mKO mice display enhanced skeletal muscle glucose metabolism. Hyperinsulinemic–euglycemic clamp studies performed on mice on a HFD for 8 wk (n = 5 per group) measured whole-body glucose infusion rate (A), glucose disposal (B), glycogen content in tibialis anterior (C), hepatic glucose production (D), and glucose uptake (E) in skeletal muscle (extensor digitorum longus [EDL], tibialis anterior [TA], and diaphragm [DIAPH]), the brain, and WAT using 3H-2-deoxyglucose tracer. (F) Glycogen content in quadriceps in the fed state. n = 5. Data are represented as mean ± SEM. (*) P < 0.05.
Figure 4.
Figure 4.
MED13 up-regulates Nurr1 expression and glucose-handling gene expression in skeletal muscle. Differentially expressed genes from Illumina RNA-seq analysis comparing RNA isolated from gastrocnemius muscle of 18-wk-old MED13-mKO and CTL mice after 12 wk on their respective diets. (A) Ingenuity Pathway Analysis was used to reveal the top cellular and molecular networks. (B) RNA expression level of Nurr1, salt-inducible kinase 1 (Sik1), and metabolic genes (glucose transporter member 4 [Glut4], glucose transporter member 1 [Glut1], solute carrier family 37 glucose-6-phosphate transporter member 2 [Slc37a2], glucose 6-phosphatase c [G6Pc], phosphoglycerate mutase 2 [Pgam2], 2,3-bisphosphoglycerate mutase [Bpgm], phosphorylase glycogen muscle [Pygm], phosphorylase kinase α1 [Phka1], protein phosphatase 1, regulatory subunit 3C [Ppp1r3c], and glycogen synthase [Gys]) measured by real-time qRT–PCR in gastrocnemius muscle from mice on a HFD for 8 wk. n = 8. (C) Real-time qRT–PCR analysis of glycolytic genes (Pgam2, Pygm, and Phka1) expressed in C2C12 myotubes infected with CTL retrovirus and retrovirus expressing Nurr1. (D) Glucose uptake in myotubes infected with CTL retrovirus and retrovirus expressing Nurr1. Data are represented as mean ± SEM. (*) P < 0.05; (**) P < 0.005.
Figure 5.
Figure 5.
Regulation of the Glut4 and Nurr1 promoters. (A) Structure of the Glut4 promoter and sequences of NRE and MRE sites. (B) ChIP assays showing binding of NURR1 and MEF2 to the Glut4 promoter in mouse skeletal muscle. Antibodies against NURR1 and MEF2 were used in ChIP assays for the Glut4 promoter. Graphs display mean quantification of ChIP (percentage of input) normalized to IgG control. n = 3. (C) Transcriptional activation of the Glut4 promoter linked to the luciferase reporter in COS7 cells by NURR1, MEF2, and MED13. Promoters with mutations in the NRE- and MRE-binding sites were also included as indicated. (D) Coimmunoprecipitation (co-IP) experiments were performed by cotransfecting Myc-tagged MEF2 and Flag-tagged NURR1 in HEK293 cells. Antibodies against the Myc epitope were used for co-IP. The extracts (input) from HEK293 cells and the proteins from the immunoprecipitation were analyzed by immunoblotting (IB). Representative results for co-IP (repeated three times) are shown. (E) Schematic MRE site in the cis-proximal enhancer region of the Nurr1 gene. (F) ChIP assays showing binding of MEF2 to the Nurr1 promoter in mouse skeletal muscle. Antibodies against MEF2 or IgG were used in ChIP assays for the Nurr1 promoter. Graphs display the mean quantification of ChIP (percentage of input) normalized to IgG control. n = 3. (G) Transcriptional activation of the Nurr1 cis-proximal enhancer region linked to the luciferase reporter in COS7 cells by MEF2. A cis-proximal enhancer region with a mutation in the MRE site was also tested. (H) Co-IP experiments were performed by cotransfecting Flag-tagged Nurr1 and GFP-tagged Med13 in HEK293 cells. Antibodies against the GFP epitope were used for co-IP. The extracts (input) from HEK293 cells and the proteins from the immunoprecipitation were analyzed by immunoblotting (IB). Representative results for co-IP (repeated three times) are shown. (IL) ChIP assays showing binding of NURR1 and MEF2 to the Glut4 promoter and r18S gene in skeletal muscle of CTL and MED13-mKO mice on a NC diet and HFD, as indicated. Data are represented as mean ± SEM. Significant differences between conditions are indicated by asterisks ([*] P < 0.05; [**]] P < 0.005; [***] P < 0.0005), and significant differences in the same condition between wild-type constructs and mutants are indicated by double S ([§] P < 0.05; [§§] P < 0.005; [§§§] P < 0.0005).
Figure 6.
Figure 6.
A model depicting MED13 regulation of NURR1–MEF2 activity and the influence of skeletal muscle MED13 on liver steatosis. (A) MED13 represses SIK1 expression, which allows activation of MEF2 and its target genes, including Nurr1. MED13 represses the expression and activity of Nurr1, which acts together with MEF2 as an activator of Glut4 and other genes involved in glucose metabolism in muscle. In the absence of MED13, MEF2 activates Nurr1 transcription. Consequently, increased NURR1 expression, together with MEF2, activates Glut4 transcription. (B) In HFD-induced insulin resistance, insulin fails to promote muscle glucose uptake and disposal, therefore directing glucose to de novo lipogenesis in the liver. Increased insulin and glucose levels in the HFD-induced insulin-resistant state stimulate hepatic nutrient sensors to drive the expression of genes involved in de novo lipogenesis. Under HFD conditions, MED13 exerts a repressive effect on glucose handling genes through the NURR1/MEF2 regulatory pathway. (C) Med13 deletion in skeletal muscle leads to an increase in the expression of glucose-handling genes and Nurr1 expression that generates an insulin-sensitizing effect with enhanced skeletal muscle glucose disposal and glycogen storage, which improves hyperinsulinemia. This effect is sensed primarily by the liver and influences it in two ways. First, since MED13-mKO skeletal muscle disposes of and stores glucose as glycogen, less glucose is diverted to the liver for lipid storage. Second, it leads to a decrease in compensatory insulin secretion by the pancreas followed by a reduction of hyperinsulinemia that results in decreased hepatic lipogenesis. Red arrows represent the processes occurring in CTL mice in HFD conditions. Green arrows represent the processes occurring in MED13-mKO mice in HFD conditions.

References

    1. Allen BL, Taatjes DJ. 2015. The Mediator complex: a central integrator of transcription. Nat Rev Mol Cell Biol 16: 155–166. - PMC - PubMed
    1. Ayala JE, Bracy DP, McGuinness OP, Wasserman DH. 2006. Considerations in the design of hyperinsulinemic-euglycemic clamps in the conscious mouse. Diabetes 55: 390–397. - PubMed
    1. Baskin KK, Grueter CE, Kusminski CM, Holland WL, Bookout AL, Satapati S, Kong YM, Burgess SC, Malloy CR, Scherer PE, et al. 2014. MED13-dependent signaling from the heart confers leanness by enhancing metabolism in adipose tissue and liver. EMBO Mol Med 6: 1610–1621. - PMC - PubMed
    1. Belakavadi M, Fondell JD. 2010. Cyclin-dependent kinase 8 positively cooperates with mediator to promote thyroid hormone receptor-dependent transcriptional activation. Mol Cell Biol 30: 2437–2448. - PMC - PubMed
    1. Berdeaux R, Goebel N, Banaszynski L, Takemori H, Wandless T, Shelton GD, Montminy M. 2007. SIK1 is a class II HDAC kinase that promotes survival of skeletal myocytes. Nat Med 13: 597–603. - PubMed

Publication types