

Detection of preperimetric glaucoma using Bruch membrane opening, neural canal and posterior pole asymmetry analysis of optical coherence tomography
- PMID: 26883374
- PMCID: PMC4756350
- DOI: 10.1038/srep21743
Detection of preperimetric glaucoma using Bruch membrane opening, neural canal and posterior pole asymmetry analysis of optical coherence tomography
Abstract
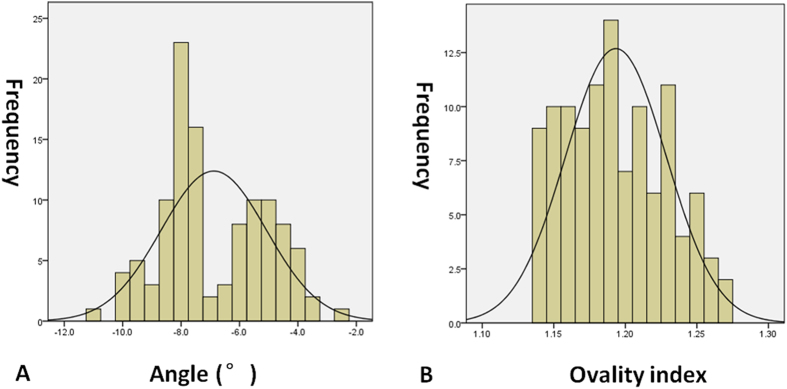
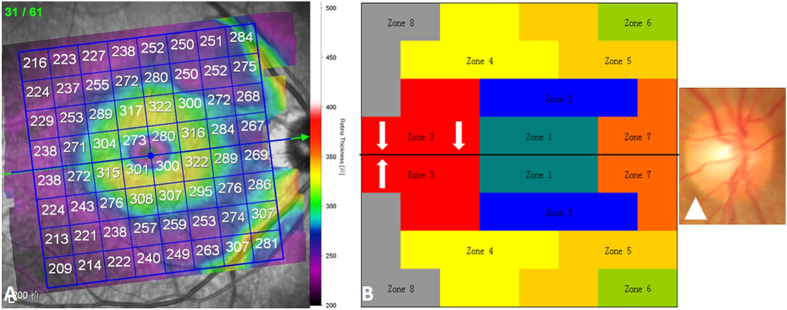
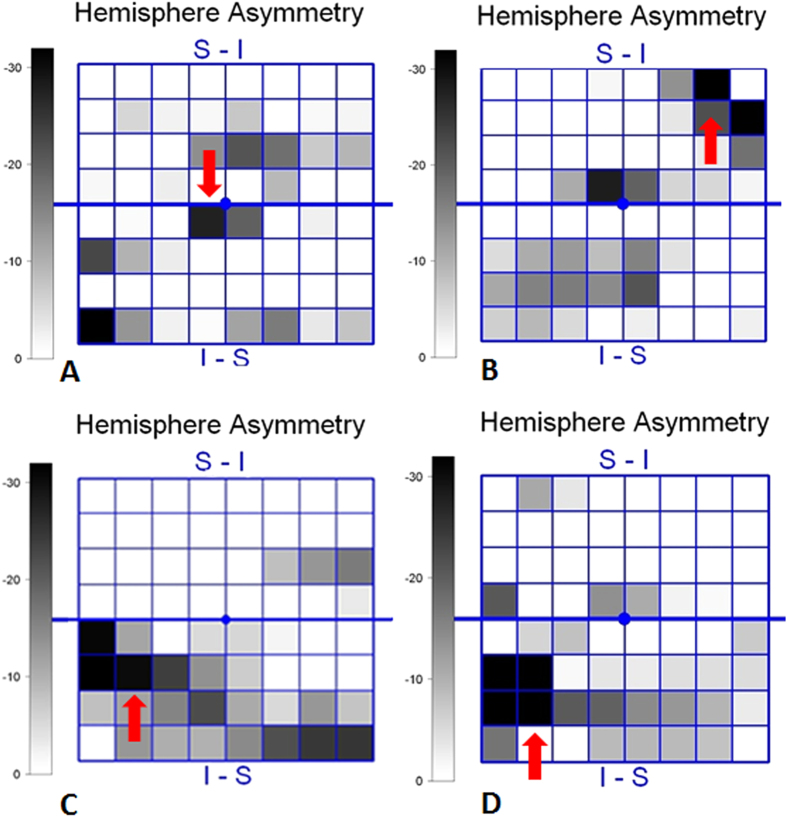
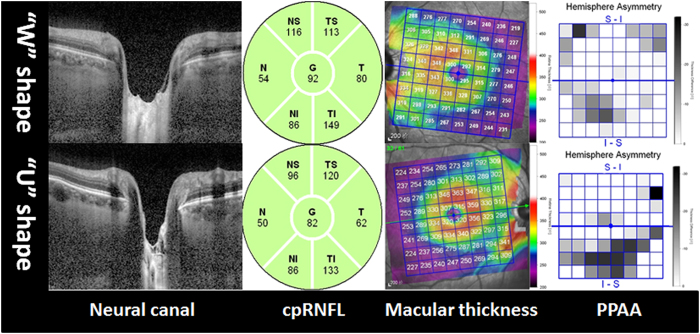
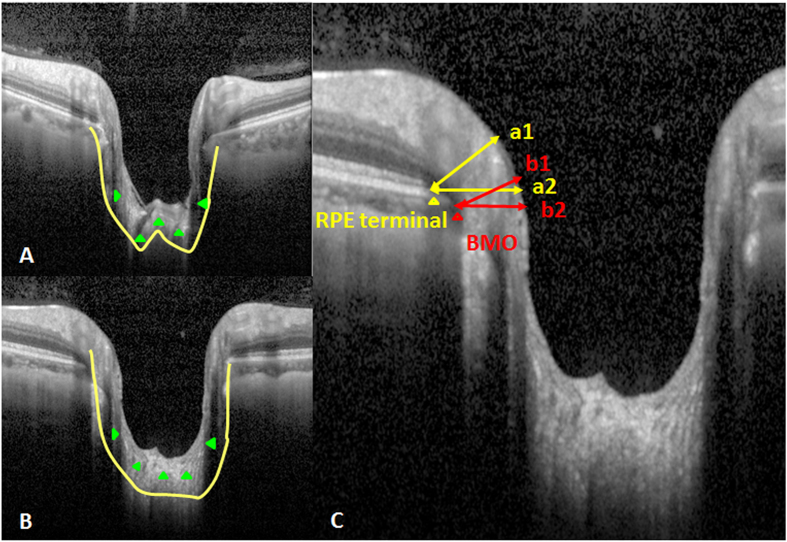
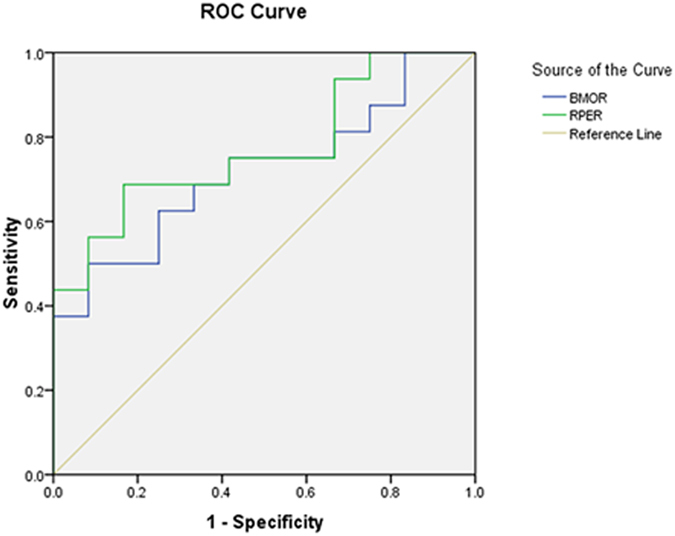
We analysed retinal nerve fibre layer (RNFL) defects in eyes with normal circumpapillary RNFL (cpRNFL) thickness using posterior pole asymmetry analysis (PPAA) and investigated the parameters of Bruch membrane opening (BMO) and neural canals using enhanced depth imaging spectral domain optical coherence tomography (EDI-SDOCT). A total of 112 preperimetric glaucomatous eyes of 92 patients were examined to obtain cpRNFL thickness using SD-OCT. Posterior pole asymmetry analysis (PPAA) and central cross-sectional images of the optic nerve head (ONH) were obtained using EDI-SDOCT. Minimal and horizontal distances between the BMO and ONH surfaces (BMOM, BMOH) and the terminal of retinal pigment epithelium (RPE) and ONH surfaces (RPEM, RPEH) were measured. The distribution of the absolute black cells in PPAA was more concentrated in eyes with "U"-shaped neural canals (p < 0.0001). The area under the receiver operating characteristic curve of the ratio of RPEM to RPEH (RPE-R, 0.771 ± 0.08) was significantly larger than the ratio of BMOM to BMOH (BMO-R, 0.719 ± 0.009) for PPAA results. A U-shaped neural canal, lower ratio of RPEM to RPEH, and lower ratio of BMOM to BMOH were considered early indicators of RNFL defects in preperimetric glaucomatous eyes with normal cpRNFL.
Figures
Similar articles
-
Detection of localized retinal nerve fiber layer defects with posterior pole asymmetry analysis of spectral domain optical coherence tomography.Invest Ophthalmol Vis Sci. 2012 Jul 1;53(8):4347-53. doi: 10.1167/iovs.12-9673. Invest Ophthalmol Vis Sci. 2012. PMID: 22577076
-
Detection of macular ganglion cell loss in preperimetric glaucoma patients with localized retinal nerve fibre defects by spectral-domain optical coherence tomography.Clin Exp Ophthalmol. 2013 Dec;41(9):870-80. doi: 10.1111/ceo.12142. Epub 2013 Jul 5. Clin Exp Ophthalmol. 2013. PMID: 23777476
-
The use of Bruch's membrane opening-based optical coherence tomography of the optic nerve head for glaucoma detection in microdiscs.Br J Ophthalmol. 2017 Apr;101(4):530-535. doi: 10.1136/bjophthalmol-2016-308957. Epub 2016 Jul 19. Br J Ophthalmol. 2017. PMID: 27436783
-
Ability of different scanning protocols of spectral domain optical coherence tomography to diagnose preperimetric glaucoma.Invest Ophthalmol Vis Sci. 2013 Nov 1;54(12):7252-7. doi: 10.1167/iovs.13-12731. Invest Ophthalmol Vis Sci. 2013. PMID: 24114539
-
Optical Coherence Tomography in Glaucoma.J Curr Glaucoma Pract. 2012 Jan-Apr;6(1):1-5. doi: 10.5005/jp-journals-10008-1099. Epub 2012 Oct 16. J Curr Glaucoma Pract. 2012. PMID: 27990063 Free PMC article. Review.
Cited by
-
Macular imaging with optical coherence tomography in glaucoma.Surv Ophthalmol. 2020 Nov-Dec;65(6):597-638. doi: 10.1016/j.survophthal.2020.03.002. Epub 2020 Mar 19. Surv Ophthalmol. 2020. PMID: 32199939 Free PMC article. Review.
-
Optic nerve head injury and optical coherence tomography angiography.Quant Imaging Med Surg. 2021 Oct;11(10):4497-4503. doi: 10.21037/qims-20-1218. Quant Imaging Med Surg. 2021. PMID: 34604003 Free PMC article. No abstract available.
-
Scleral Cross-Linking in Form-Deprivation Myopic Guinea Pig Eyes Leads to Glaucomatous Changes.Invest Ophthalmol Vis Sci. 2022 May 2;63(5):24. doi: 10.1167/iovs.63.5.24. Invest Ophthalmol Vis Sci. 2022. PMID: 35594036 Free PMC article.
-
Posterior Pole Asymmetry Analysis as a Diagnostic Tool in Glaucoma Suspects: An Electrophysiological Approach.Clin Ophthalmol. 2023 Jun 21;17:1777-1787. doi: 10.2147/OPTH.S411647. eCollection 2023. Clin Ophthalmol. 2023. PMID: 37366515 Free PMC article.
-
Posterior pole retinal thickness distribution pattern in keratoconus.Int Ophthalmol. 2020 Nov;40(11):2807-2816. doi: 10.1007/s10792-020-01464-8. Epub 2020 Jun 18. Int Ophthalmol. 2020. PMID: 32556673
References
-
- Suh M. H., Kim D. M., Kim Y. K., Kim T. W. & Park K. H. Patterns of progression of localized retinal nerve fibre layer defect on red-free fundus photographs in normal-tension glaucoma. Eye (Lond) 24, 857–863 (2010). - PubMed
-
- Aref A. A. & Budenz D. L. Spectral domain optical coherence tomography in the diagnosis and management of glaucoma. Ophthalmic Surg Lasers Imaging 41, S15–27 (2010). - PubMed
-
- Kim T. W., Park U. C., Park K. H. & Kim D. M. Ability of Stratus OCT to identify localized retinal nerve fiber layer defects in patients with normal standard automated perimetry results. Invest Ophthalmol Vis Sci 48, 1635–1641 (2007). - PubMed
-
- Jeoung J. W., Park K. H., Kim T. W., Khwarg S. I. & Kim D. M. Diagnostic ability of optical coherence tomography with a normative database to detect localized retinal nerve fiber layer defects. Ophthalmology 112, 2157–2163 (2005). - PubMed
Publication types
MeSH terms
LinkOut - more resources
Full Text Sources
Other Literature Sources
Medical
