. 2016 Apr;26(4):427-39.
doi: 10.1101/gr.198754.115. Epub 2016 Feb 16.

Great ape Y Chromosome and mitochondrial DNA phylogenies reflect subspecies structure and patterns of mating and dispersal

Affiliations

Great ape Y Chromosome and mitochondrial DNA phylogenies reflect subspecies structure and patterns of mating and dispersal

Pille Hallast et al. Genome Res. 2016 Apr.

Abstract

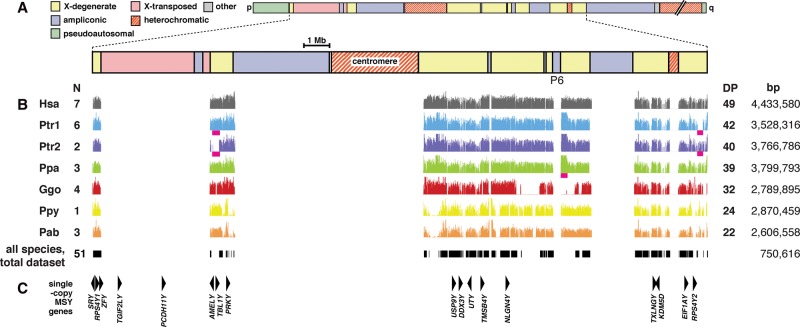
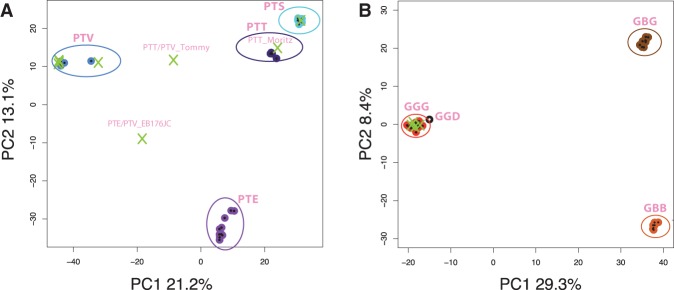
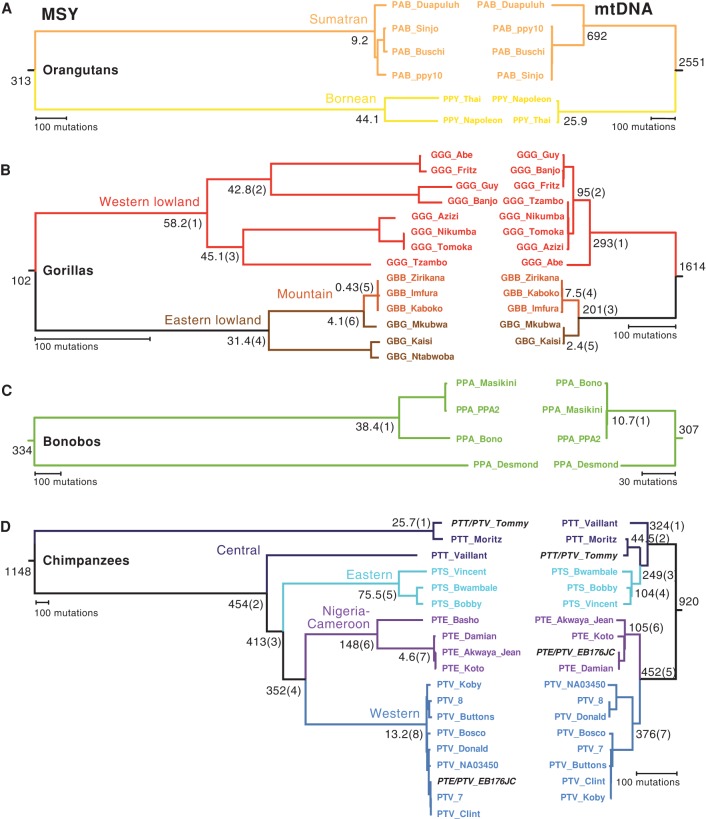
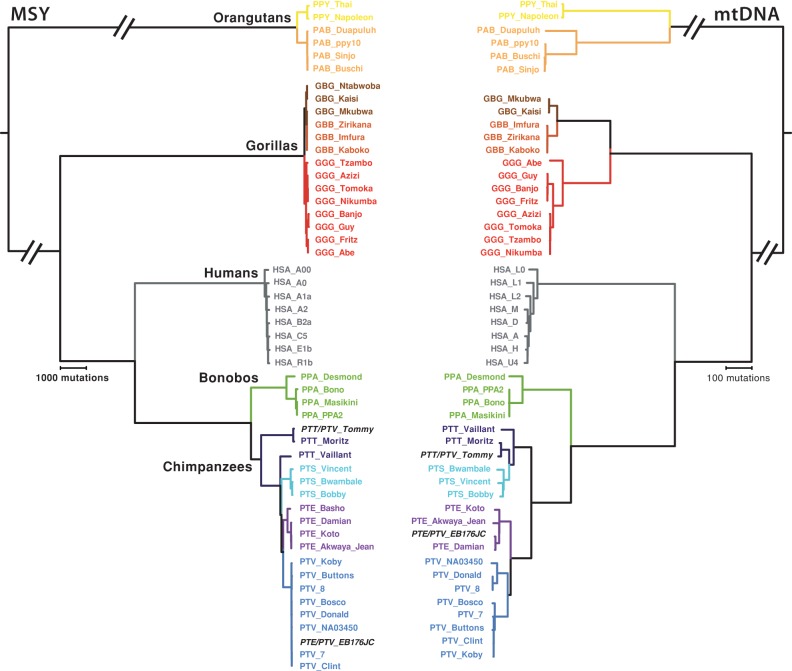
The distribution of genetic diversity in great ape species is likely to have been affected by patterns of dispersal and mating. This has previously been investigated by sequencing autosomal and mitochondrial DNA (mtDNA), but large-scale sequence analysis of the male-specific region of the Y Chromosome (MSY) has not yet been undertaken. Here, we use the human MSY reference sequence as a basis for sequence capture and read mapping in 19 great ape males, combining the data with sequences extracted from the published whole genomes of 24 additional males to yield a total sample of 19 chimpanzees, four bonobos, 14 gorillas, and six orangutans, in which interpretable MSY sequence ranges from 2.61 to 3.80 Mb. This analysis reveals thousands of novel MSY variants and defines unbiased phylogenies. We compare these with mtDNA-based trees in the same individuals, estimating time-to-most-recent common ancestor (TMRCA) for key nodes in both cases. The two loci show high topological concordance and are consistent with accepted (sub)species definitions, but time depths differ enormously between loci and (sub)species, likely reflecting different dispersal and mating patterns. Gorillas and chimpanzees/bonobos present generally low and high MSY diversity, respectively, reflecting polygyny versus multimale-multifemale mating. However, particularly marked differences exist among chimpanzee subspecies: The western chimpanzee MSY phylogeny has a TMRCA of only 13.2 (10.8-15.8) thousand years, but that for central chimpanzees exceeds 1 million years. Cross-species comparison within a single MSY phylogeny emphasizes the low human diversity, and reveals species-specific branch length variation that may reflect differences in long-term generation times.


Figures

Figure 1.
Figure 1.
Location and extent of sequenced great ape MSY-orthologous regions compared to the human reference sequence. (A) Schematic representation of the human Y Chromosome (Skaletsky et al. 2003) showing blocks of different sequence classes. (B) The analyzed subregions of MSY, shown as plots of read depth against chromosome position. Note that the order and orientation of MSY sequences in the great apes is not necessarily the same as that in the human reference sequence. In each plot, the y-axis ranges from zero to 150×. Sample size (N) for each species is given to the left, and mean depth (DP) and the extent of sequence obtained (bp) to the right. (Hsa) human; (Ptr) chimpanzee; (Ppa) bonobo; (Ggo) gorilla; (Ppy) Bornean orangutan; (Pab) Sumatran orangutan. Chimpanzees carry two distinct structural variant sequences (Ptr1 and 2) differing by insertion/deletions highlighted by magenta bars. Similarly highlighted is a Pan-specific duplication that extends palindrome P6. Below the species plots, black bars indicate sequenced regions shared across all 51 males (43 great apes and seven humans as a representative subset from the 448 sequenced samples, plus one haplogroup A00 human) (Hallast et al. 2015; Karmin et al. 2015), totaling 750,616 bp, and used in constructing the cross-species phylogeny shown in Figure 4 (see below). (C) Locations of single-copy MSY genes (Skaletsky et al. 2003; Bellott et al. 2014) shown as triangles (not drawn to scale) pointing in the direction of transcription.
Figure 2.
Figure 2.
Confirmation of subspecies status in chimpanzees and gorillas using PCA of autosomal SNPs. PCA plots based on autosomal SNP variation: (A) the eight chimpanzees sequenced here (crosses), plus 25 published individuals (Prado-Martinez et al. 2013) of known subspecies status (circles); (B) the four gorillas sequenced here (crosses), plus 44 published individuals (Prado-Martinez et al. 2013; Xue et al. 2015) of known subspecies status (circles). (PTT) Pan troglodytes troglodytes; (PTS) P. t. schweinfurthii; (PTE) P. t. ellioti; (PTV) P. t. verus; (GGG) Gorilla gorilla gorilla; (GGD) G. g. diehli; (GBB) G. beringei beringei; (GBG) G. b. graueri.
Figure 3.
Figure 3.
MSY and mtDNA phylogenies in great ape species. MSY (left) and mtDNA (right) phylogenies: (A) orangutans; (B) gorillas; (C) bonobos; (D) chimpanzees. Note that not all phylogenies are to the same mutational scale, which is indicated in each case by a scale bar. Point estimates of TMRCA are given adjacent to selected nodes (95% HPD intervals are available in Table 2); numbers in parentheses highlight specific nodes discussed elsewhere. Species/subspecies are indicated, and names of individuals are given at the tips of branches, as listed in Supplemental Table S1. (PAB) Pongo abelii; (PPY) P. pygmaeus; (GGG) Gorilla gorilla gorilla; (GBB) G. beringei beringei; (GBG) G. b. graueri; (PPA) Pan paniscus; (PTT) Pan troglodytes troglodytes; (PTS) P. t. schweinfurthii; (PTE) P. t. ellioti; (PTV) P. t. verus. The two chimpanzee cross-subspecies hybrids are indicated by black italic type; despite his hybrid status, Tommy has both MSY and mtDNA sequences characteristic of central chimpanzees (PTT), whereas EB176JC carries a typically western (PTV) MSY and a Nigeria-Cameroon (PTE) mtDNA sequence. Separate PCA analysis of X-Chromosomal SNPs shows that the X Chromosome of EB176JC clusters with P. t. ellioti X Chromosomes (Supplemental Fig. S2).
Figure 4.
Figure 4.
Cross-species MSY and mtDNA phylogenies. Species/subspecies names and names of great ape individuals are given at the tips of branches as in Figure 3. For each human sample, “HSA” (Homo sapiens) is followed by the MSY or mtDNA haplogroup name, as listed in Supplemental Table S1. For both MSY and mtDNA, the orangutan branches are truncated for display purposes.

References

    1. Alexander DH, Novembre J, Lange K. 2009. Fast model-based estimation of ancestry in unrelated individuals. Genome Res 19: 1655–1664. - PMC - PubMed
    1. Archidiacono N, Storlazzi CT, Spalluto C, Ricco AS, Marzella R, Rocchi M. 1998. Evolution of chromosome Y in primates. Chromosoma 107: 241–246. - PubMed
    1. Batini C, Lopes J, Behar DM, Calafell F, Jorde LB, van der Veen L, Quintana-Murci L, Spedini G, Destro-Bisol G, Comas D. 2011. Insights into the demographic history of African Pygmies from complete mitochondrial genomes. Mol Biol Evol 28: 1099–1110. - PubMed
    1. Batini C, Hallast P, Zadik D, Delser PM, Benazzo A, Ghirotto S, Arroyo-Pardo E, Cavalleri GL, de Knijff P, Dupuy BM, et al. 2015. Large-scale recent expansion of European patrilineages shown by population resequencing. Nat Commun 6: 7152. - PMC - PubMed
    1. Becquet C, Patterson N, Stone AC, Przeworski M, Reich D. 2007. Genetic structure of chimpanzee populations. PLoS Genet 3: e66. - PMC - PubMed

Publication types

Substances

LinkOut - more resources