. 2016 Feb 17:7:10730.
doi: 10.1038/ncomms10730.

Deciphering the importance of the palindromic architecture of the immunoglobulin heavy-chain 3' regulatory region

Affiliations

Deciphering the importance of the palindromic architecture of the immunoglobulin heavy-chain 3' regulatory region

Alexis Saintamand et al. Nat Commun. .

Abstract

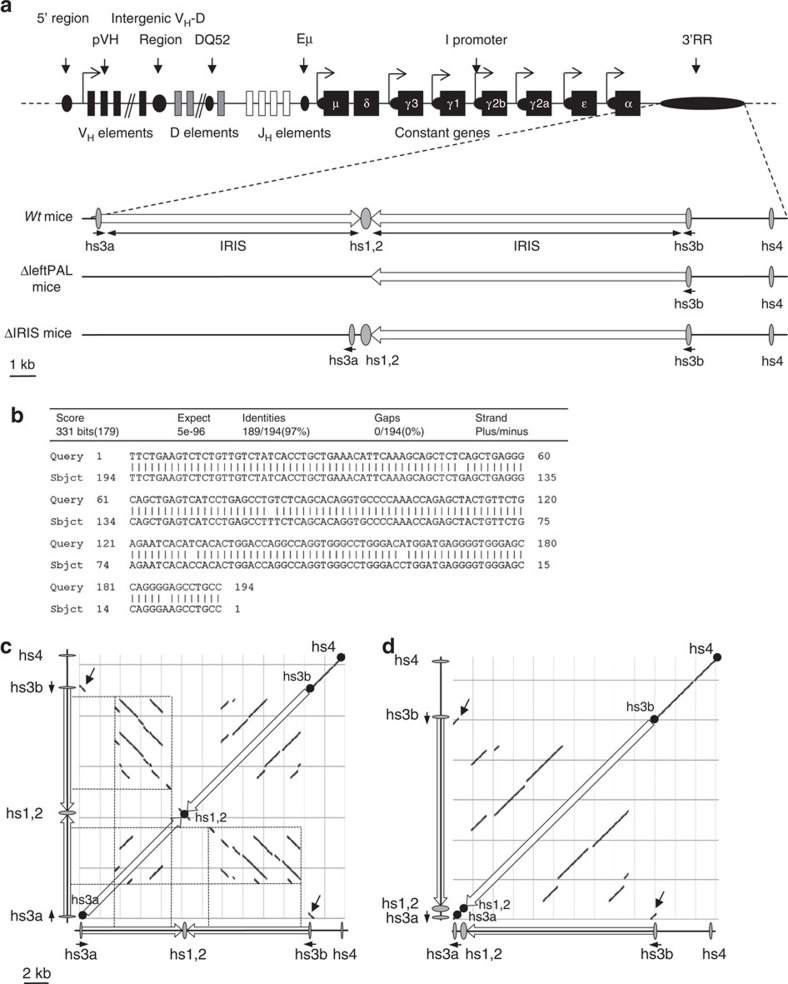
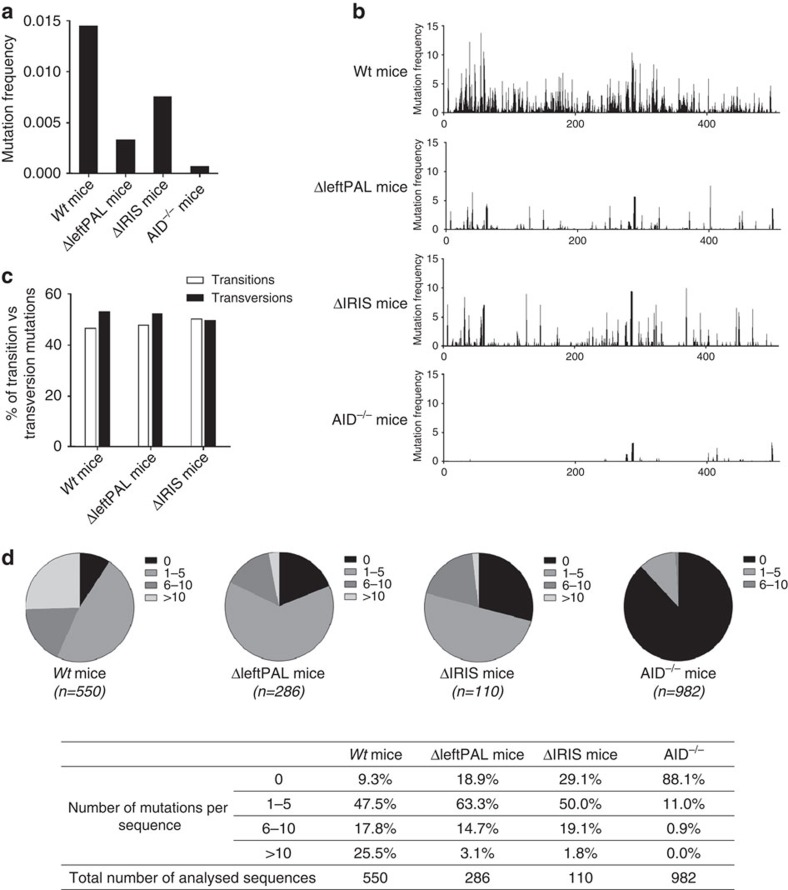
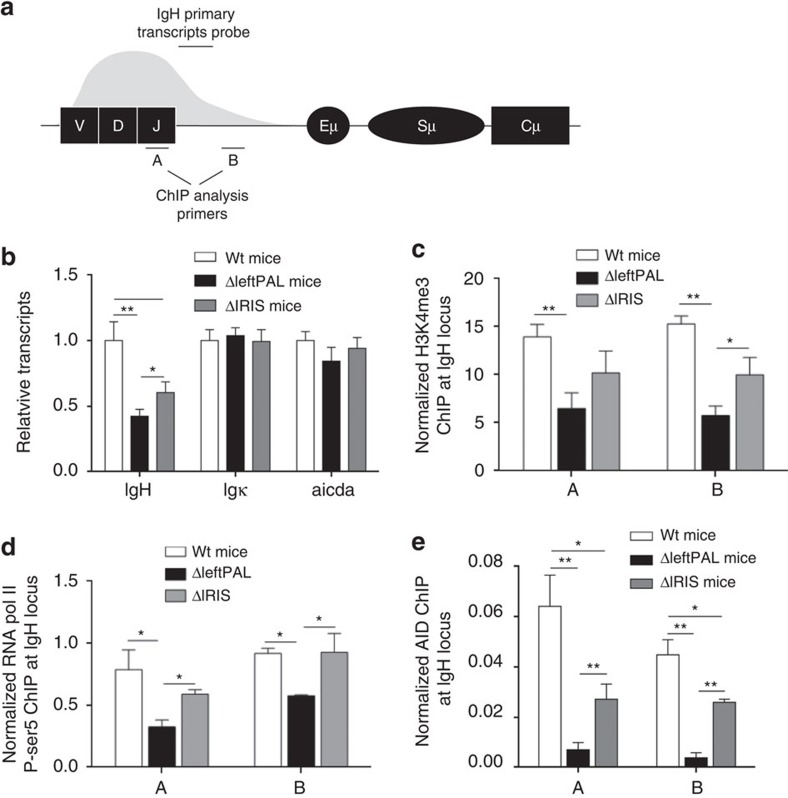
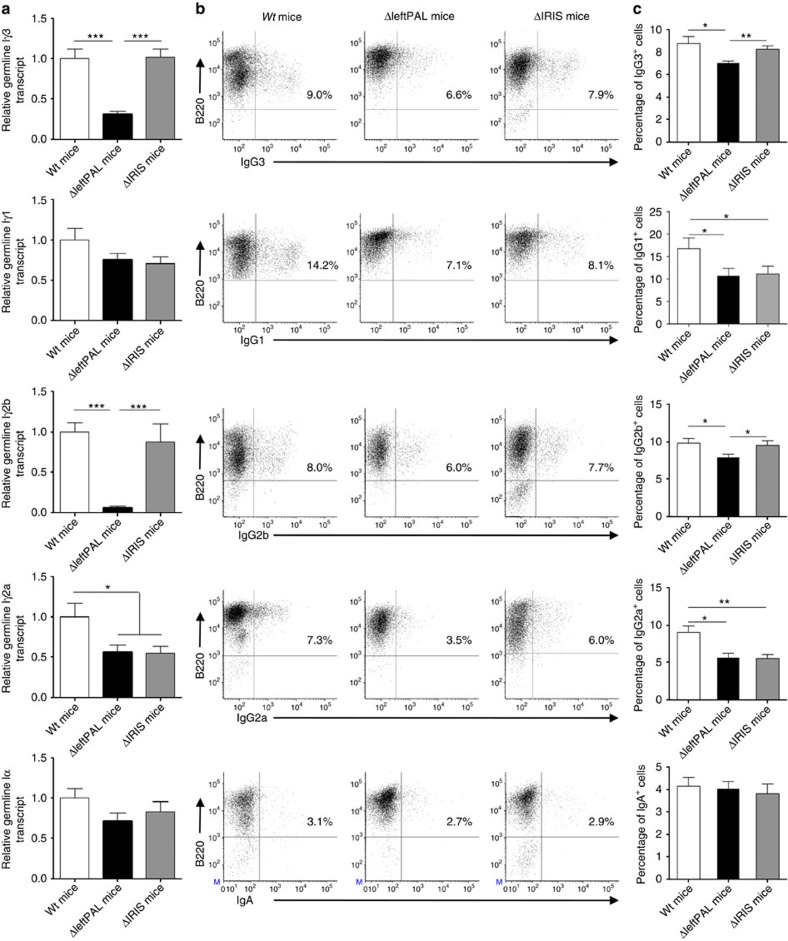
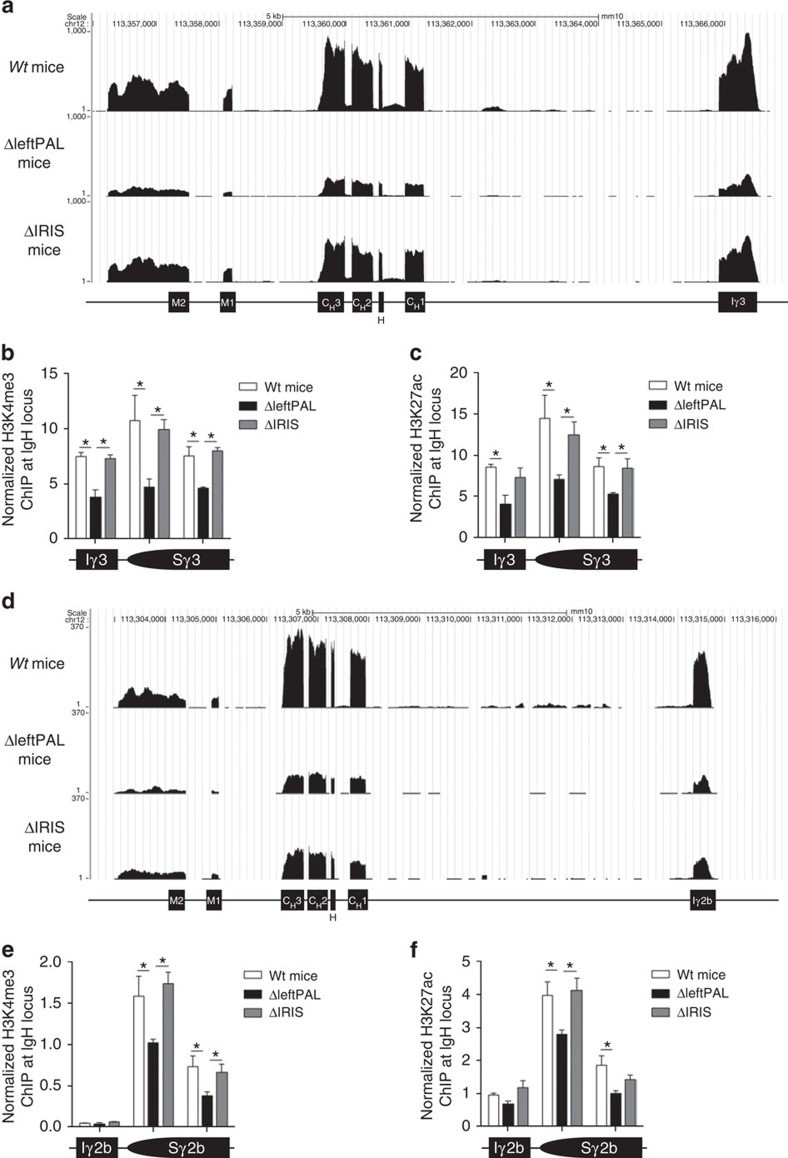
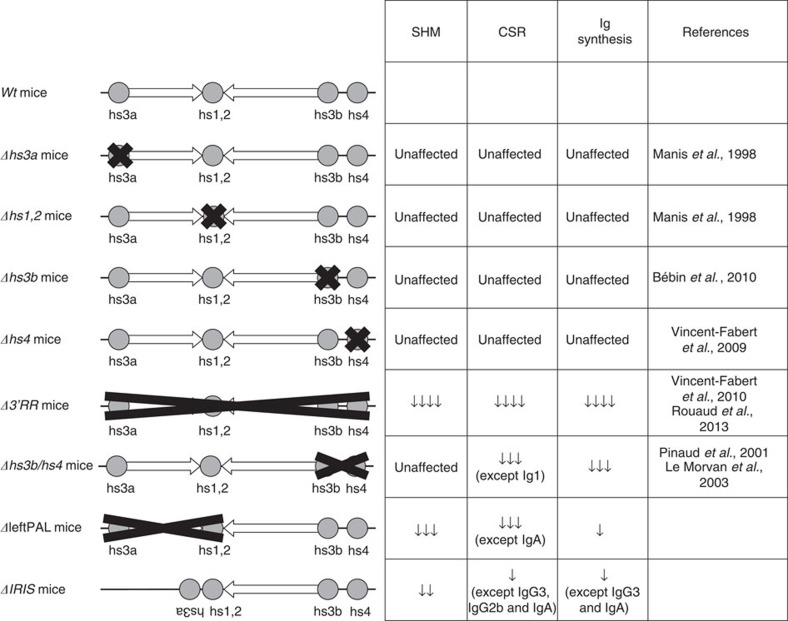
The IgH 3' regulatory region (3'RR) controls class switch recombination (CSR) and somatic hypermutation (SHM) in B cells. The mouse 3'RR contains four enhancer elements with hs1,2 flanked by inverted repeated sequences and the centre of a 25-kb palindrome bounded by two hs3 enhancer inverted copies (hs3a and hs3b). hs4 lies downstream of the palindrome. In mammals, evolution maintained this unique palindromic arrangement, suggesting that it is functionally significant. Here we report that deconstructing the palindromic IgH 3'RR strongly affects its function even when enhancers are preserved. CSR and IgH transcription appear to be poorly dependent on the 3'RR architecture and it is more or less preserved, provided 3'RR enhancers are present. By contrast, a 'palindromic effect' significantly lowers VH germline transcription, AID recruitment and SHM. In conclusion, this work indicates that the IgH 3'RR does not simply pile up enhancer units but also optimally exposes them into a functional architecture of crucial importance.


Figures

Figure 1
Figure 1. Palindromic structure of the IgH 3'RR.
(a) Upper part: The mouse IgH locus (not on the scale). Lower part: The 3'RR with its four enhancer elements and the IRIS (on the scale). ΔleftPAF and ΔIRIS mice are represented. (b) Sequence and homology between hs3a and hs3b enhancers (in opposite orientation in the chromosome). (c,d) DNA sequence dot-plot of the 3'RR in wt (c) and ΔIRIS mice (d) showing self similarity. The main diagonal represents the sequence alignment with itself. Parallel lines to the main diagonal represent repetitive patterns within the sequence (that is, tandem repeat), whereas perpendicular lines to the main diagonal represent similar but inverted sequences, thus allowing to identify the palindromic structures (dotted lines). The inversion of hs3a enhancer (black arrows) and the deletion of the intervening sequences between hs3a and hs1,2 in ΔIRIS mice totally disrupts the palindromic structure, despite the presence of all enhancer elements.
Figure 2
Figure 2. Influence of the 3'RR palindrome on SHM.
(a) SHM in VH regions of ΔleftPAL, ΔIRIS and wt mice. Mice were immunised orally with sheep red blood cells for 2 weeks and intraperitoneally with 10 μg of LPS for 3 days. B220+GL7+Fas+ cells from Peyer's patches were sorted and pooled, and extracted DNA was amplified by PCR and submitted to high-throughput sequencing to evaluate SHM. VH SHM values were normalised to Jκ5 SHM values. Mean values from six mice for all genotypes were reported (8–12 weeks old, male and female). (b) SHM were found all along the analysed 3'JH4 DNA segment and hot spot of mutations were evidenced in both genotypes. Same mice as in a. (c) The proportion of transitions and transversions did not significantly differ between wt, ΔleftPAL and ΔIRIS mice. Same mice as in a. (d) Percentages of sequences with 0, 1–5, 6–10 and >10 mutations. (n): number of analysed sequences. Same mice as in a.
Figure 3
Figure 3. Mechanism underlying the 3'RR palindromic effect on SHM.
(a) Locations of probes (A,B) for ChIP experiments and PCR primers for IgH transcription. (b): IgH, Igκ and AICDA transcription in ΔleftPAL, ΔIRIS and wt mice. Mice were immunised orally with sheep red blood cells for 2 weeks and intraperitoneally with 10 μg of LPS for 3 days. Peyer's patch cell RNA was extracted and transcripts were amplified by real-time PCR. Data are the mean±s.e.m. of six independent experiments with one mouse per genotype (8–12 weeks old, male and female). *P<0.05 and **P<0.001 (Mann–Whitney's U-test for significance). Values were normalised to GAPDH transcripts. (c) ChIP analysis of H3K4me3 in VH regions in Peyer's patch cells in ΔleftPAL, ΔIRIS and wt mice. Background ChIP signals from mock samples with irrelevant antibody were subtracted. ChIP values were normalised to the total input DNA. Data are the mean±s.e.m. of four independent experiments (8- to 12-week-old mice, male and female). *P<0.05, **P<0.01 (Mann–Whitney U-test). ChIP experiments were done in A and B locations (as in a). Same immunisation protocol as in b. (d) ChIP analysis of pol II paused in VH regions in Peyer's patches cells in ΔleftPAL, ΔIRIS and wt mice. Data are the mean±s.e.m. of four independent experiments (8- to 12-week-old mice, male and female). *P<0.05, **P<0.01 (Mann–Whitney U-test). Same immunisation protocol as in b. (e) ChIP analysis of AID recruitment in VH regions in Peyer's patch cells in ΔleftPAL, ΔIRIS and wt mice. Data are the mean±s.e.m. of five independent experiments (8- to 12-week-old mice, male and female). *P<0.05, **P<0.01 (Mann–Whitney U-test). Same immunisation protocol as in b.
Figure 4
Figure 4. Influence of the 3'RR palindrome on GLT and CSR.
(a) GLT in B splenocytes of ΔleftPAL, ΔIRIS and wt mice. Cells were stimulated with LPS±IL-4, INFγ and TGFβ for 2 days. 1-Cγ1, 2a-Cγ2a, 2b-Cγ2b, 3-Cγ3 and Iα-Cα GL transcription was investigated by real-time PCR. Mean±s.e.m. of six independent experiments with one mouse (8–12 weeks old, male and female). *P<0.05 and ***P<0.0001 (Mann–Whitney U-test for significance). Values were normalised to GAPDH transcripts. (b) CSR in B splenocytes of ΔleftPAL, ΔIRIS and wt mice. Cells were stimulated with LPS±IL-4, INFγ and TGFβ for 3 days. Cells were then labelled with anti-B220-APC antibodies and anti-IgG1-, anti-IgG2a-, anti-IgG2b-, anti-IgG3- and anti-IgA-FITC antibodies. One representative experiment out of six (one mouse per experiment) is shown (8- to 12-week-old mice, male and female). (c) Mean±s.e.m. of six independent experiments of CSR with one mouse (8–12 weeks old, male and female). *P<0.05 and **P<0.001 (Mann–Whitney U-test for significance).
Figure 5
Figure 5. Influence of the 3'RR palindrome on IgH transcription and activation of epigenetic marks during CSR.
(a) 3-Cγ3 transcription in ΔleftPAL, ΔIRIS and wt mice. CD43-depleted splenocytes were cultured for 2 days with 5 μg of LPS. RNAseq experiments were performed after depletion of rRNA. Data are the mean of two independent experiments with three mice per genotype (8- to 12-week-old-male mice) (b) ChIP analysis of H3K4me3 in Iγ3-Cγ3 in ΔleftPAL, ΔIRIS and wt mice. Data are the mean±s.e.m. of four independent experiments (8- to 12-week-old mice, male and female). *P<0.05 (Mann–Whitney U-test). (c) ChIP analysis of H3K27ac in 3-Cγ3 in ΔleftPAL, ΔIRIS and wt mice. Data are the mean±s.e.m. of four independent experiments (8- to 12-week-old mice, male and female). *P<0.05 (Mann–Whitney U-test). (d) 2b-Cγ2b transcription (RNAseq experiments) in ΔleftPAL, ΔIRIS and wt mice. Same mice as in a. (e) ChIP analysis of H3K4me3 in 2b-Cγ2b in ΔleftPAL, ΔIRIS and wt mice. Data are the mean±s.e.m. of four independent experiments (8- to 12-week-old mice, male and female). *P<0.05 (Mann–Whitney U-test). (f) ChIP analysis of H3K27ac in 2b-Cγ2b in ΔleftPAL, ΔIRIS and wt mice. Data are the mean±s.e.m. of four independent experiments (8- to 12-week-old mice, male and female). *P<0.05 (Mann–Whitney U-test).
Figure 6
Figure 6. Influence of the 3'RR palindrome on BCR expression and B-cell fate.
(a) Flow cytometry analysis of transitional (TR) B cells (AA4.1+), follicular (FO) B cells (CD21lowCD23high) and marginal zone (MZ) B cells (CD21highCD23low). One representative experiment out of five is shown (8- to 12-week-old mice, male and female). (b) TR, FO and MZ B cells expressing the a or b allele in aΔleftPAL/bwt, aΔIRIS /bwt and awt/bwt mice. One representative experiment out of five is shown (left part). Mean±s.e.m. of five mice for all genotypes (right part; 8–12-week-old mice, male and female). (c) Mean±s.e.m. of membrane IgM densities on TR, FO and MZ B cells expressing the a or b allele in aΔleftPAL/bwt, aΔIRIS /bwt and awt/bwt mice (8–12-week-old mice, male and female). (d) Flow cytometry analysis of plasmablasts (B220+CD138+) in spleen of homozygous aΔleftPAL/bwt, aΔIRIS /bwt and awt/bwt mice. One representative experiment out of three is shown (8- to 12-week-old mice, male and female). (e) Expression of IgM on plasmablasts of homozygous ΔleftPAL, ΔIRIS and wt mice. One representative experiment out of three is shown (8- to 12-week-old mice, male and female).
Figure 7
Figure 7. Influence of the 3'RR palindrome on Ig synthesis.
(a) ELISA analysis of IgG1, IgG2a, IgG2b, IgG3 and IgA in supernatants of LPS±IL-4-, INFγ- and TGFβ-stimulated splenocytes of ΔleftPAL, ΔIRIS and wt mice. Data are the mean±s.e.m. of eight experiments with one mouse (8–12 weeks old, male and female). *P<0.05, **P<0.01 and **P<0.001 (Mann–Whitney U-test for significance). (b) ELISA analysis of IgM, IgG1, IgG2a, IgG2b, IgG3 and IgA in plasma of 10 ΔleftPAL, 9 ΔIRIS mice and 18 wt mice (8 weeks old, male and female). Mean±s.e.m. *P<0.05, **P<0.01 and **P<0.001 (Mann–Whitney U-test for significance). (c) Ovalbumin-specific IgM, IgG1, IgG2a and IgG2b. Antibody levels, detected by ELISA, are expressed in arbitrary units by comparison with control plasma values. Time after immunisation is indicated in days. Each point is the mean±s.e.m. of plasma determinations from six mice for each genotype (8–12 weeks old, male and female). One representative experiment out of two is shown.
Figure 8
Figure 8. Mutants of the 3'RR enhancers.
References and main results are reported and compared with ΔleftPAL and ΔIRIS mice.

References

    1. Henderson A. & Calame K. Transcription regulation during B cell development. Annu. Rev. Immunol. 16, 163–200 (1998). - PubMed
    1. Pinaud E. et al.. The IgH locus 3' regulatory region: pulling the strings from behind. Adv. Immunol. 110, 27–70 (2011). - PubMed
    1. Perlot T., Alt F. W., Bassing C. H., Suh H. & Pinaud E. Elucidation of IgH intronic enhancer functions via germ-line deletion. Proc. Natl Acad. Sci. USA 42, 14362–14367 (2005). - PMC - PubMed
    1. Marquet M. et al.. The Eμ enhancer region influences H chain expression and B cell fate without impacting IgVH repertoire and immune response in vivo. J. Immunol. 193, 1171–1183 (2014). - PubMed
    1. Saintamand A. et al.. The IgH 3' regulatory region governs μ chain transcription in mature B lymphocytes and the B cell fate. Oncotarget 6, 4845–4852 (2015). - PMC - PubMed

Publication types

Substances