. 2016 Mar;39(3):229-41.
doi: 10.14348/molcells.2016.2244. Epub 2016 Feb 16.

Histone Deacetylase-3/CAGE Axis Targets EGFR Signaling and Regulates the Response to Anti-Cancer Drugs

Affiliations

Histone Deacetylase-3/CAGE Axis Targets EGFR Signaling and Regulates the Response to Anti-Cancer Drugs

Hyuna Kim et al. Mol Cells. 2016 Mar.

Abstract

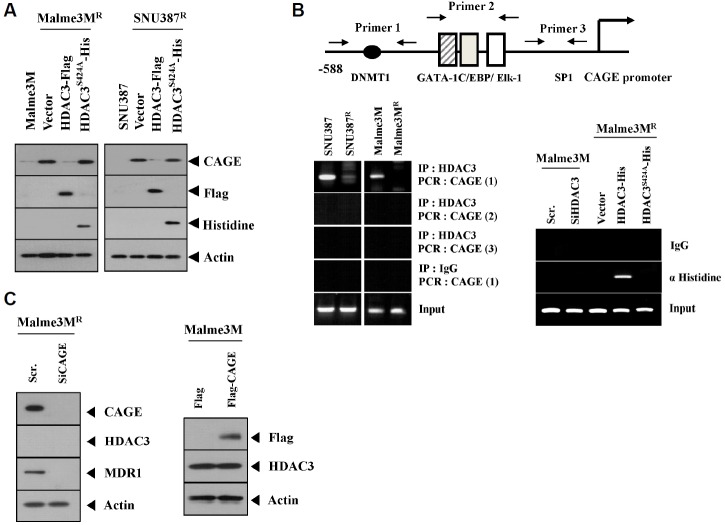
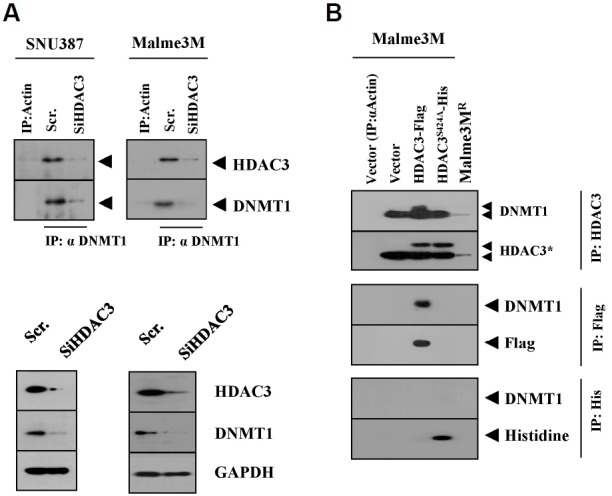
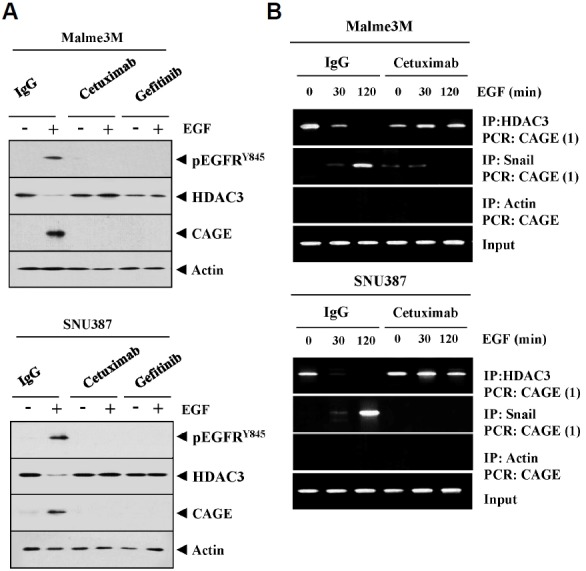
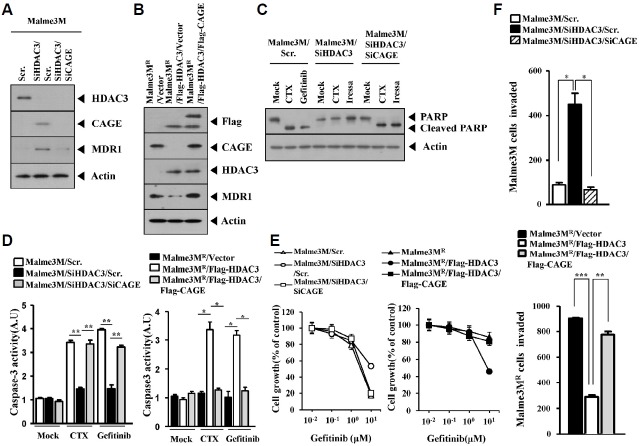
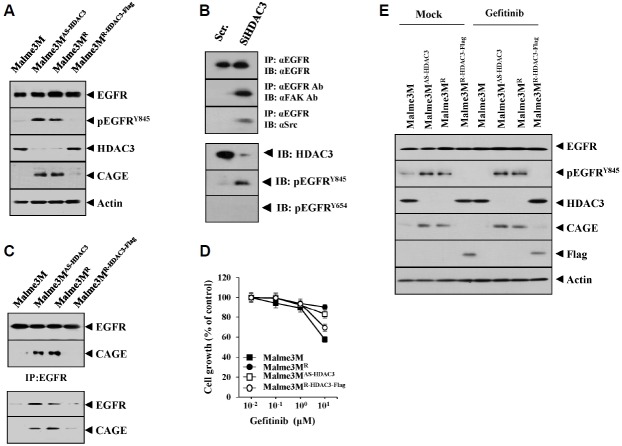
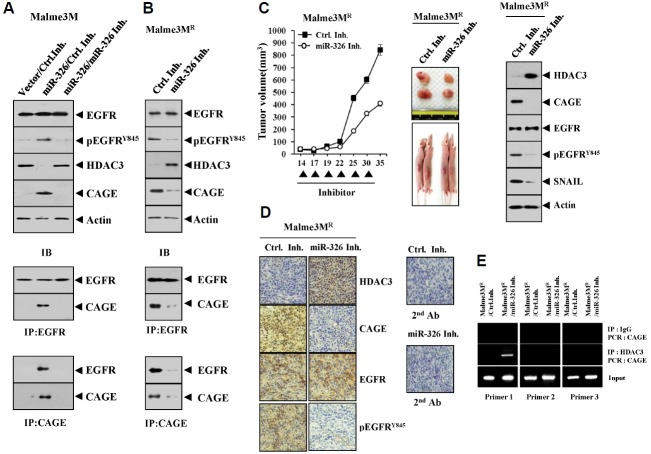
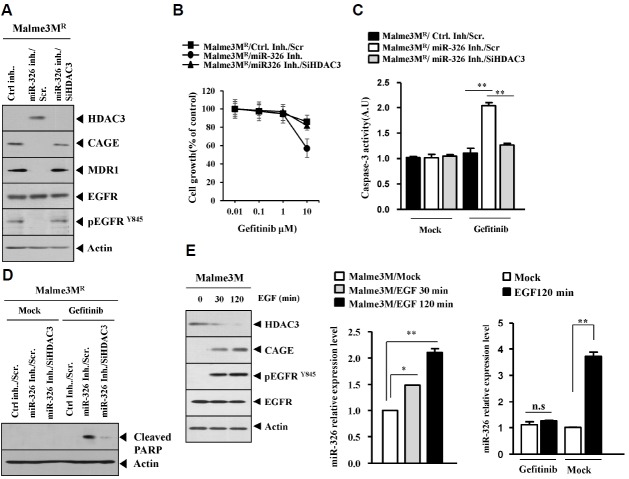
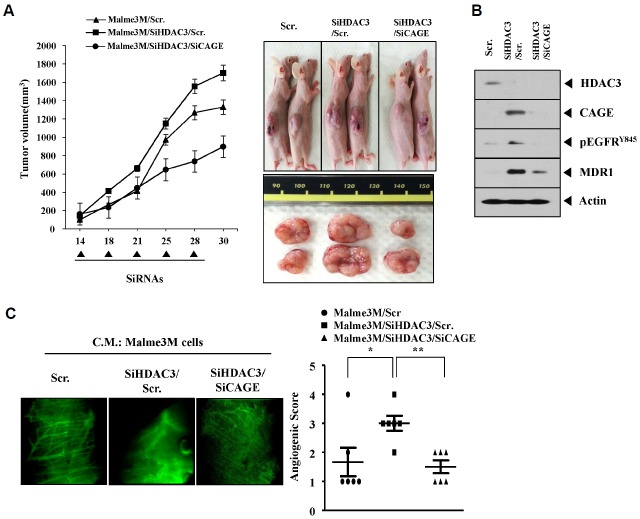
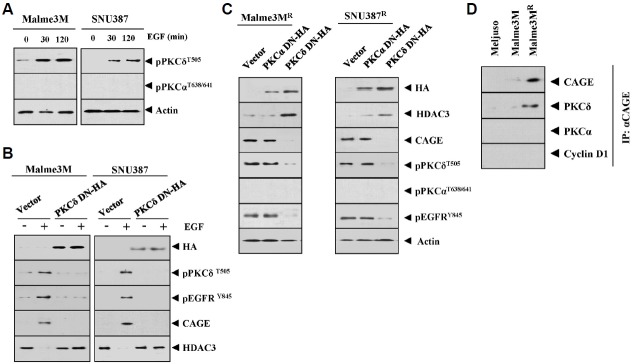
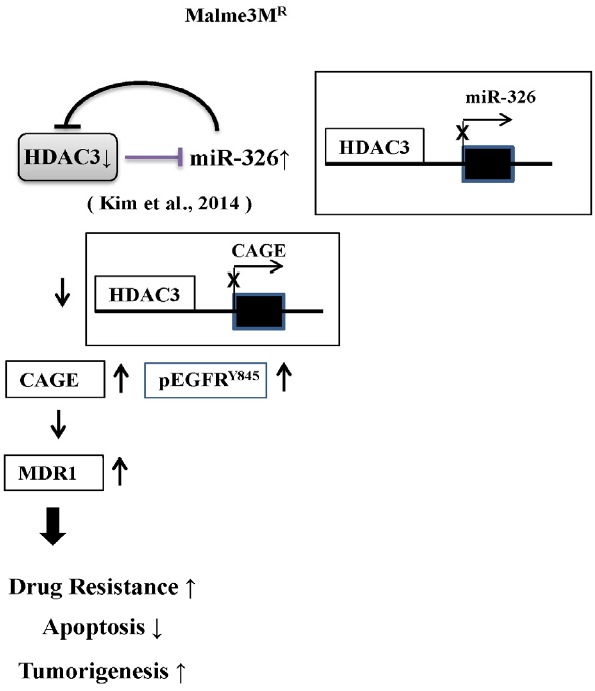
We have previously reported the role of miR-326-HDAC3 loop in anti-cancer drug-resistance. CAGE, a cancer/testis antigen, regulates the response to anti-cancer drug-resistance by forming a negative feedback loop with miR-200b. Studies investigating the relationship between CAGE and HDAC3 revealed that HDAC3 negatively regulated the expression of CAGE. ChIP assays demonstrated the binding of HDAC3 to the promoter sequences of CAGE. However, CAGE did not affect the expression of HDAC3. We also found that EGFR signaling regulated the expressions of HDAC3 and CAGE. Anti-cancer drug-resistant cancer cell lines show an increased expression of pEGFR(Y845). HDAC3 was found to negatively regulate the expression of pEGFR(Y845). CAGE showed an interaction and co-localization with EGFR. It was seen that miR-326, a negative regulator of HDAC3, regulated the expression of CAGE, pEGFR(Y845), and the interaction between CAGE and EGFR. miR-326 inhibitor induced the binding of HDAC3 to the promoter sequences in anti-cancer drug-resistant Malme3M(R) cells, decreasing the tumorigenic potential of Malme3M(R) cells in a manner associated with its effect on the expression of HDAC3, CAGE and pEGFR(Y845). The down-regulation of HDAC3 enhanced the tumorigenic, angiogenic and invasion potential of the anti-cancer drug-sensitive Malme3M cells in CAGE-dependent manner. Studies revealed that PKCδ was responsible for the increased expression of pEGFR(Y845) and CAGE in Malme3M(R) cells. CAGE showed an interaction with PKCδ in Malme3M(R) cells. Our results show that HDAC3-CAGE axis can be employed as a target for overcoming resistance to EGFR inhibitors.

Keywords: CAGE; EGFR; HDAC3; anti-cancer drug-resistance.


Figures

Fig. 1.
Fig. 1.
HDAC3 regulates the expression of CAGE. (A) The indicated cancer cells were transiently transfected with wild type HDAC3 or mutant HDAC3 (HDAC3S424A). At 48 h post transfection, cell lysates were subjected to Western blot analysis. Cell lysates from SNU387 or Malme3M cells were also subjected to Western blot analysis. (B) Cell lysates isolated from the indicated cancer cells were subjected to ChIP assays (left panel). The indicated cancer cells were transiently transfected with the indicated siRNA (10 nM) or construct (1 μg). At 48 h post transfection, cell lysates were isolated and subjected to ChIP assays (right panel). (C) The indicated cancer cells were transiently transfected with the indicated siRNA (10 nM) or construct (1 μg). At 48 h post transfection, cell lysates were subjected to Western blot analysis.
Fig. 2.
Fig. 2.
HDAC3 interacts with DNMT1. (A) SNU387 or Malme3M cells were transfected with scrambled siRNA (10 nM) or HDAC3 siRNA (10 nM). At 48 h after transfection, cell lysates were immunoprecipitated with the indicated antibody, followed by Western blot analysis (upper panel). Cell lysates were also subjected to Western blot analysis (lower panel). (B) Malme3M cells were transfected with the indicated construct (1 μg each). At 48 h after transfection, cell lysates were immunoprecipitated with the indicated antibody, followed by Western blot analysis.
Fig. 3.
Fig. 3.
EGFR signaling regulates the expression of HDAC3 and CAGE. (A) Malme3M or SNU387 cells were pretreated with IgG (2 μg/ml), cetuximab (2 μg/ml) or gefitinib (10 μM) for 24 h. The next day, cells were then treated with EGF (50 ng/ml) for 1 h, followed by Western blot analysis. (B) Malme3M or SNU387 cells were pre-treated with IgG (2 μg/ml), cetuximab (2 μg/ml) or gefitinib (10 μM) for 24 h. The next day, cells were then treated with EGF (50 ng/ml) for various time intervals, followed by ChIP assays.
Fig. 4.
Fig. 4.
HDAC3 targets CAGE to regulate the sensitivity to EGFR inhibitors and invasion potential of cancer cells. (A) Malme3M cells were transiently transfected with the indicated siRNAs (each at 10 nM). At 48 h after transfection, cell lysates were subjected to Western blot analysis. (B) Malme3MR cells were transiently transfected with the indicated constructs (each at 1 μg). At 48 h after transfection, cell lysates were subjected to Western blot analysis. (C) Malme3M cells were transiently transfected with the indicated siRNAs (each at 10 nM). Next day, cells were then treated with cetuximab (2 μg/ml) or gefitinib (10 μM) for 24 h, followed by Western blot analysis. (D) Malme3M cells were transiently transfected with the indicated siRNAs (each at 10 nM). The following day, cells were then treated with cetuximab (2 μg/ml) or gefitinib (10 μM) for 24 h, followed by caspase-3 activity assays (left panel). Malme3MR cells were transiently transfected with the indicated construct (each at 1 μg) and similarly treated (right panel). *p < 0.05; **p < 0.005. (E) Malme3M cells were transiently transfected with the indicated siRNAs (each at 10 nM). The next day, cells were then treated with various concentrations of gefitinib for 24h, followed by MTT assays (left panel). Malme3MR cells were transiently transfected with the indicated construct (each at 1 μg). The next day, cells were then treated with various concentrations of gefitinib for 24 h, followed by MTT assays (right panel). (F) The indicated cancer cells were transfected with the indicated siRNAs (each at 10 nM). At 48 h after transfection, cells were then subjected to chemoinvasion assays. *p < 0.05; ** p < 0.005; ***p < 0.0005.
Fig. 5.
Fig. 5.
HDAC3 regulates the activation of EGR and induces an interaction between CAGE and EGFR. (A) Cell lysates isolated from the indicated cancer cells were subjected to Western blot analysis. (B) Malme3M cells were transiently transfected with the indicated siRNA (each at 10 nM). At 48 h after transfection, cell lysates were immunoprecipitated with the indicated antibody (2 μg/ml), followed by Western blot analysis. Cell lysates were also subjected to Western blot analysis. (C) Cell lysates isolated from the indicated cancer cells were immunoprecipitated with the indicated antibody (2 μg/ml), followed by Western blot analysis. (D) The indicated cancer cells were treated with various concentrations of gefitinib for 48 h, followed by MTT assays. (E) The indicated cancer cells were treated with gefitinib (1 μM) for 48 h, followed by Western blot analysis (lower panel).
Fig. 6.
Fig. 6.
miR-326, a negative regulator of HDAC3, regulates the activation of EGFR and an interaction between CAGE and EGFR. (A) Malme3M cells were transiently transfected with control vector or miR-326 construct (each at 1 μg) along with the indicated inhibitor (each at 10 nM). At 48 h after transfection, cell lysates were immunoprecipitated with the indicated antibody (2 μg/ml), followed by Western blot analysis. Cell lysates were also subjected to Western blot analysis. (B) Malme3MR cells were transiently transfected with the indicated inhibitor (each at 10 nM). At 48 h after transfection, cell lysates were subjected to immunoprecipitation and Western blot analysis. (C) Malme3MR cells (1 × 10⁶) were injected into the dorsal flank area of athymic nude mouse. Control inhibitor (40 μg/kg or 50 μM/kg) or miR-326 inhibitor (40 μg/kg or 50 μM/kg) was injected into each nude mouse after the tumor reached a certain size. Tumor volume was measured on the same day as injection of inhibitor. Each value represents an average obtained from five mice of each group. Tumor tissue lysates from each mouse of the experimental group were subjected to Western blot. (D) immunohistochemical staining of tumor tissue derived from Malme3MR cells treated with the indicated inhibitor was performed as described. Immunohistochemistry staining employing secondary antibody alone served as a negative control. Representative images from five animals from each experimental group are shown (magnification, 400X; Olympus). H&E staining was performed to check structural integrity. (E) Malme3MR cells were transiently transfected with the indicated inhibitor (each at 10 nM). At 48 h after transfection, cell lysates were subjected to ChIP assays.
Fig. 7.
Fig. 7.
miR-326 inhibitor enhances sensitivity to EGFR inhibitors. (A) Malme3MR cells were transfected with the indicated inhibitor (each at 10 nM) along with the indicated siRNA (each at 10 nM). At 48 h after transfection, cell lysates were subjected to Western blot analysis. (B) Malme3MR cells were transfected with the indicated inhibitor (each at 10 nM) along with the indicated siRNA (each at 10 nM). At 24 h after transfection, cells were treated with various concentrations of gefitinib for 24 h, followed by MTT assays. (C) Malme3MR cells were transfected with the indicated inhibitor (each at 10 nM) along with the indicated siRNA (each at 10 nM). At 24 h after transfection, cells were then treated with gefitinib (10 μM) for 24 h, followed by caspase-3 activity assays. **p < 0.005. (D) Malme3MR cells were transfected with the indicated inhibitor (each at 10 nM) along with the indicated siRNA (each at 10 nM). At 24 h after transfection, cells were then treated with gefitinib (10 μM) for 24 h, followed by Western blot analysis. (E) Malme3M cells were treated with EGF (50 ng/ml) for various time intervals. Cell lysates prepared at each time point were subjected to Western blot analysis and qRT-PCR analysis. Malme3M cells were pretreated with gefitinib (10 μM). The next day, cell were then treated with EGF (50 ng/ml) for 2 h, followed by qRT-PCR analysis (right panel). *p < 0.05; **p < 0.005.
Fig. 8.
Fig. 8.
The down-regulation of HDAC3 enhances the tumorigenic potential and angiogenic potential of cancer cells by targeting CAGE. (A) Malme3M cells (1 × 10⁶) were injected into the dorsal flank area of athymic nude mouse. The indicated siRNA (each at 10 nM) was injected into each nude mouse after the tumor reached a certain size. Tumor volume was measured on the same day as injection of siRNA. Each value represents an average obtained from five mice of each group. (B) Tumor tissue lysates from each mouse of the experimental group were subjected to Western blot. (C) Malme3M cells were transiently transfected with the indicated siRNAs. Concentrated conditioned medium (10 μl) obtained from the indicated cancer cell line was mixed with 100 μl matrigel and intravital microscopy was performed as described.
Fig. 9.
Fig. 9.
PKCδ interacts with CAGE and regulates the expression of CAGE and pEGFRY845. (A) The indicated cancer cells were treated with EGF (50 ng/ml) for various time intervals. Cell lysates prepared at each time point were subjected to Western blot analysis. (B) The indicated cancer cells were transfected with the indicated construct (each at 1 μg). At 48 h after transfection, cells were treated with EGF (50 ng/ml) for 1h, followed by Western blot analysis. (C) The indicated cancer cells were transfected with the indicated construct (each at 1μg). At 48 h after transfection, cell lysates were subjected to Western blot analysis. (D) Cell lysates isolated from the indicated cancer cells were subjected to immunoprecipitation, followed by Western blot analysis.
Fig. 10.
Fig. 10.
The proposed mechanism of anti-cancer drug-resistance regulated by HDAC-EGFR-CAGE axis.

Similar articles

Cited by

References

    1. Abera M.B., Kazanietz M.G. Protein kinase Cα mediates erlotinib resistance in lung cancer cells. Mol. Pharmacol. 2015;87:832–841. - PMC - PubMed
    1. Barter M.J., Pybus L., Litherland G.J., Rowan A.D., Clark I.M., Edwards D.R., Cawston T.E., Young D.A. HDAC-mediated control of ERK- and PI3K-dependent TGF-β-induced extracellular matrix-regulating genes. Matrix Biol. 2010;29:602–612. - PubMed
    1. Bhaskara S., Knutson S.K., Jiang G., Chandrasekharan M.B., Wilson A.J., Zheng S., Yenamandra A., Locke K., Yuan J.L., Bonine-Summers A.R., et al. Hdac3 is essential for the maintenance of chromatin structure and genome stability. Cancer Cell. 2010;18:436–447. - PMC - PubMed
    1. Boyer A.P., Collier T.S., Vidavsky I., Bose R. Quantitative proteomics with siRNA screening identifies novel mechanisms of trastuzumab resistance in HER2 amplified breast cancers. Mol. Cell. Proteomics. 2013;12:180–193. - PMC - PubMed
    1. Brodie S.A., Li G., El-Kommos A., Kang H., Ramalingam S.S., Behera M., Gandhi K., Kowalski J., Sica G.L., Khuri F.R., Vertino P.M., Brandes J.C. Class I HDACs are mediators of smoke carcinogen-induced stabilization of DNMT1 and serve as promising targets for chemoprevention of lung cancer. Cancer Prev. Res. (Phila). 2014;7:351–361. - PMC - PubMed

Publication types

MeSH terms