Integrated GlycoProteome Analyzer (I-GPA) for Automated Identification and Quantitation of Site-Specific N-Glycosylation
- PMID: 26883985
- PMCID: PMC4756296
- DOI: 10.1038/srep21175
Integrated GlycoProteome Analyzer (I-GPA) for Automated Identification and Quantitation of Site-Specific N-Glycosylation
Abstract
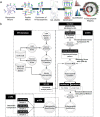
Human glycoproteins exhibit enormous heterogeneity at each N-glycosite, but few studies have attempted to globally characterize the site-specific structural features. We have developed Integrated GlycoProteome Analyzer (I-GPA) including mapping system for complex N-glycoproteomes, which combines methods for tandem mass spectrometry with a database search and algorithmic suite. Using an N-glycopeptide database that we constructed, we created novel scoring algorithms with decoy glycopeptides, where 95 N-glycopeptides from standard α1-acid glycoprotein were identified with 0% false positives, giving the same results as manual validation. Additionally automated label-free quantitation method was first developed that utilizes the combined intensity of top three isotope peaks at three highest MS spectral points. The efficiency of I-GPA was demonstrated by automatically identifying 619 site-specific N-glycopeptides with FDR ≤ 1%, and simultaneously quantifying 598 N-glycopeptides, from human plasma samples that are known to contain highly glycosylated proteins. Thus, I-GPA platform could make a major breakthrough in high-throughput mapping of complex N-glycoproteomes, which can be applied to biomarker discovery and ongoing global human proteome project.
Figures


Similar articles
-
Systems analysis of singly and multiply O-glycosylated peptides in the human serum glycoproteome via EThcD and HCD mass spectrometry.J Proteomics. 2018 Jan 6;170:14-27. doi: 10.1016/j.jprot.2017.09.014. Epub 2017 Sep 29. J Proteomics. 2018. PMID: 28970103
-
A multi-parallel N-glycopeptide enrichment strategy for high-throughput and in-depth mapping of the N-glycoproteome in metastatic human hepatocellular carcinoma cell lines.Talanta. 2019 Jul 1;199:254-261. doi: 10.1016/j.talanta.2019.02.010. Epub 2019 Feb 8. Talanta. 2019. PMID: 30952254
-
Toward Automated N-Glycopeptide Identification in Glycoproteomics.J Proteome Res. 2016 Oct 7;15(10):3904-3915. doi: 10.1021/acs.jproteome.6b00438. Epub 2016 Sep 2. J Proteome Res. 2016. PMID: 27519006
-
Glycoproteomics: A Balance between High-Throughput and In-Depth Analysis.Trends Biotechnol. 2017 Jul;35(7):598-609. doi: 10.1016/j.tibtech.2017.04.010. Epub 2017 May 17. Trends Biotechnol. 2017. PMID: 28527536 Review.
-
Tools and techniques for quantitative glycoproteomic analysis.Biochem Soc Trans. 2024 Dec 19;52(6):2439-2453. doi: 10.1042/BST20240257. Biochem Soc Trans. 2024. PMID: 39656178 Review.
Cited by
-
Characterization of Cell Glycocalyx with Mass Spectrometry Methods.Cells. 2019 Aug 13;8(8):882. doi: 10.3390/cells8080882. Cells. 2019. PMID: 31412618 Free PMC article. Review.
-
Quantitative Analysis of α-1-Antitrypsin Glycosylation Isoforms in HCC Patients Using LC-HCD-PRM-MS.Anal Chem. 2020 Jun 16;92(12):8201-8208. doi: 10.1021/acs.analchem.0c00420. Epub 2020 Jun 2. Anal Chem. 2020. PMID: 32426967 Free PMC article.
-
Site-Specific Glycan Microheterogeneity Evaluation of Aflibercept Fusion Protein by Glycopeptide-Based LC-MSMS Mapping.Int J Mol Sci. 2022 Oct 5;23(19):11807. doi: 10.3390/ijms231911807. Int J Mol Sci. 2022. PMID: 36233110 Free PMC article.
-
Strategies for Proteome-Wide Quantification of Glycosylation Macro- and Micro-Heterogeneity.Int J Mol Sci. 2022 Jan 30;23(3):1609. doi: 10.3390/ijms23031609. Int J Mol Sci. 2022. PMID: 35163546 Free PMC article. Review.
-
Large-scale intact glycopeptide identification by Mascot database search.Sci Rep. 2018 Feb 1;8(1):2117. doi: 10.1038/s41598-018-20331-2. Sci Rep. 2018. PMID: 29391424 Free PMC article.
References
-
- Barrabes S. et al. Glycosylation of serum ribonuclease 1 indicates a major endothelial origin and reveals an increase in core fucosylation in pancreatic cancer. Glycobiology 17, 388–400 (2007). - PubMed
-
- Kirmiz C. et al. A serum glycomics approach to breast cancer biomarkers. Mol. Cell. Proteomics 6, 43–55 (2007). - PubMed
-
- Toyama A. et al. Quantitative structural characterization of local N-glycan microheterogeneity in therapeutic antibodies by energy-resolved oxonium ion monitoring. Anal. Chem. 84, 9655–9662 (2012). - PubMed
Publication types
MeSH terms
Substances
LinkOut - more resources
Full Text Sources
Other Literature Sources

