. 2016 Mar 1;113(9):2394-9.
doi: 10.1073/pnas.1516967113. Epub 2016 Feb 16.

First structure of full-length mammalian phenylalanine hydroxylase reveals the architecture of an autoinhibited tetramer

Affiliations

First structure of full-length mammalian phenylalanine hydroxylase reveals the architecture of an autoinhibited tetramer

Emilia C Arturo et al. Proc Natl Acad Sci U S A. .

Abstract

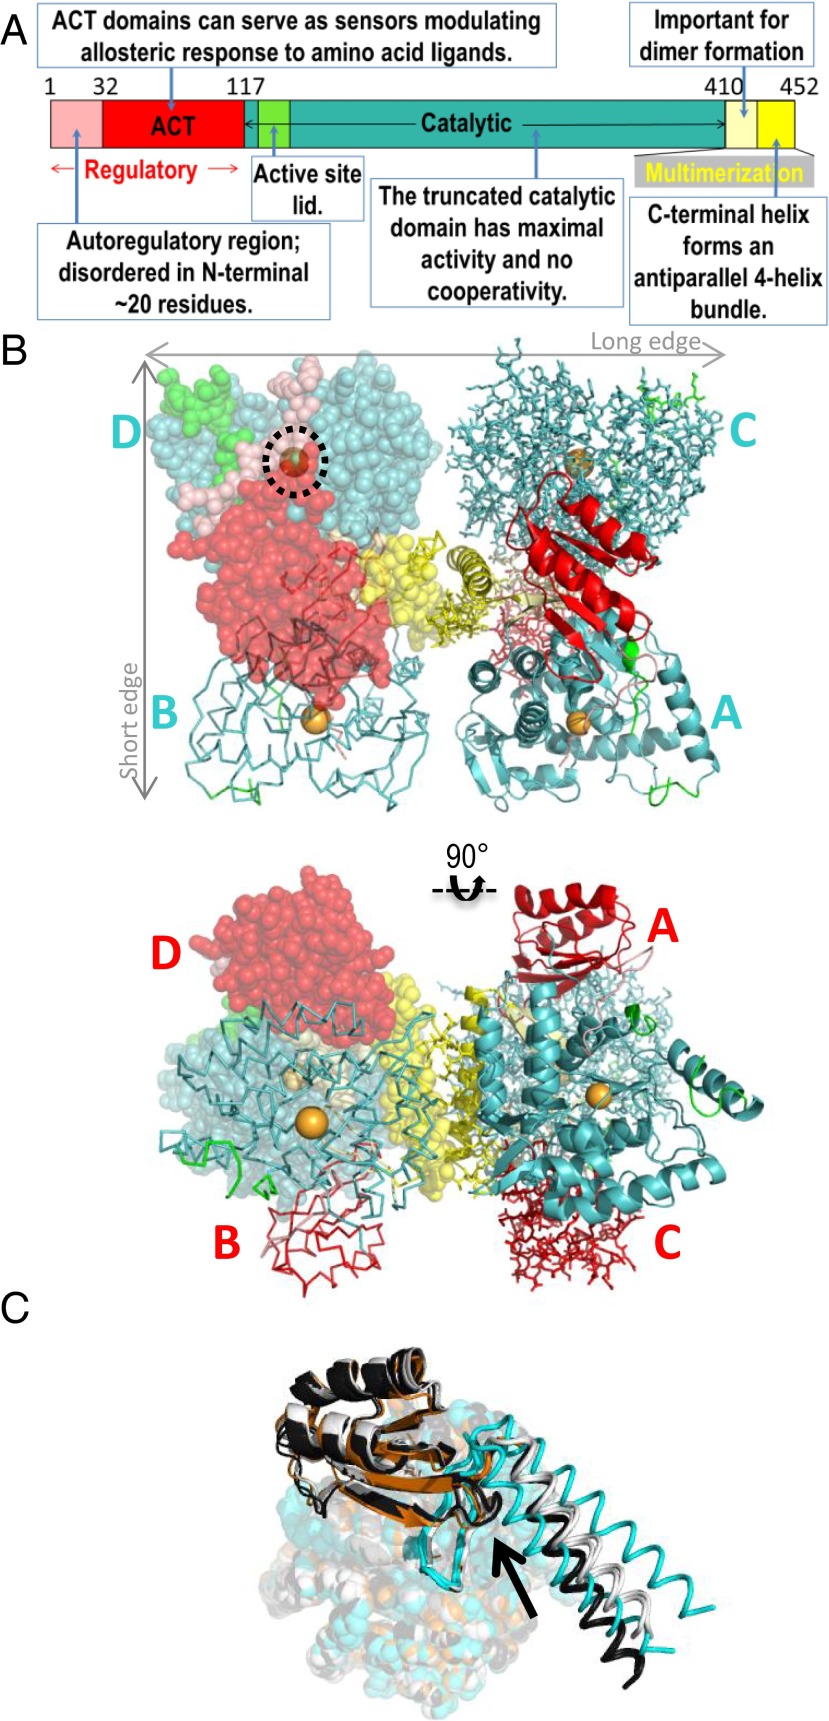
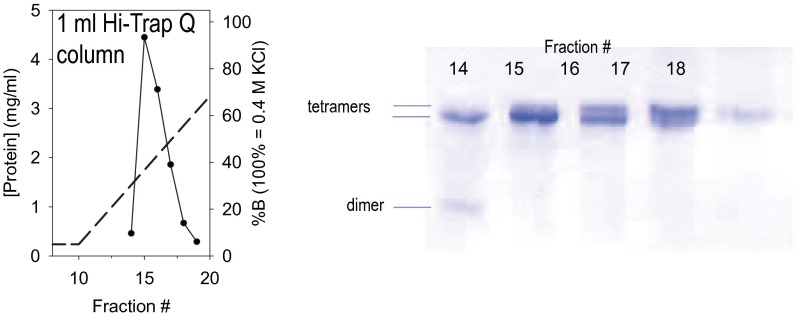
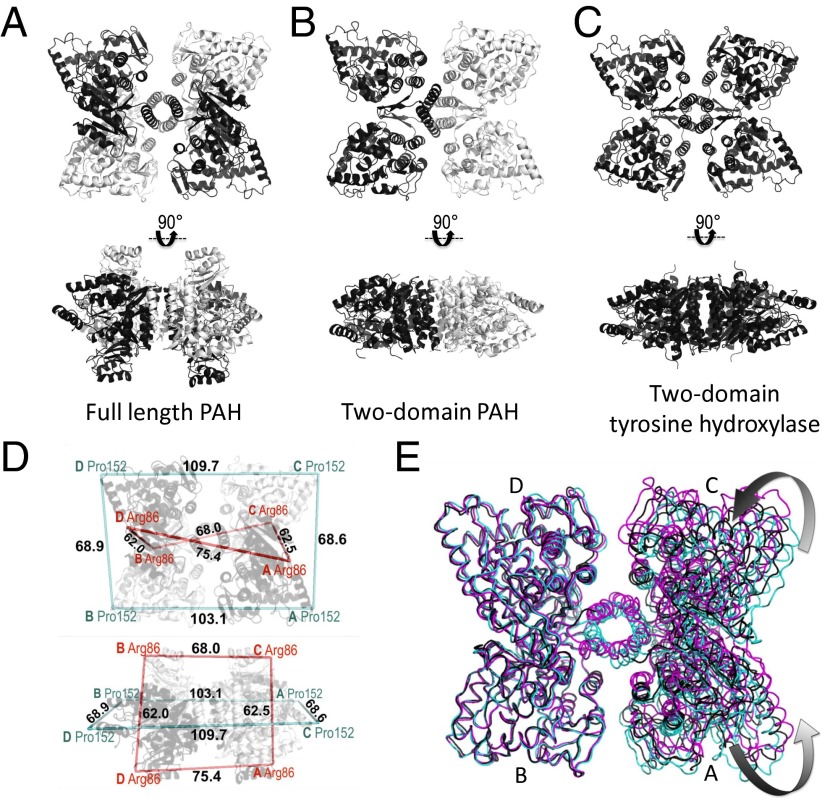
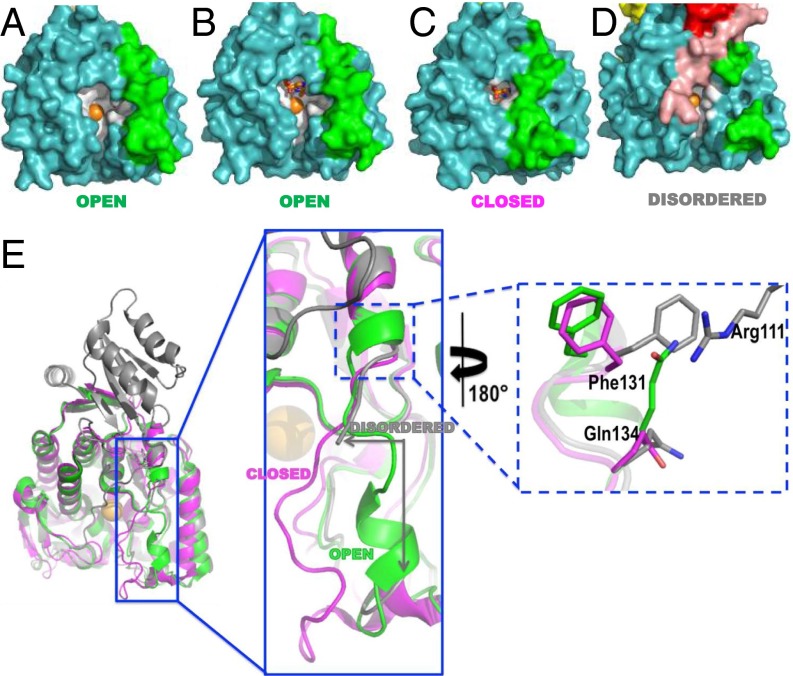
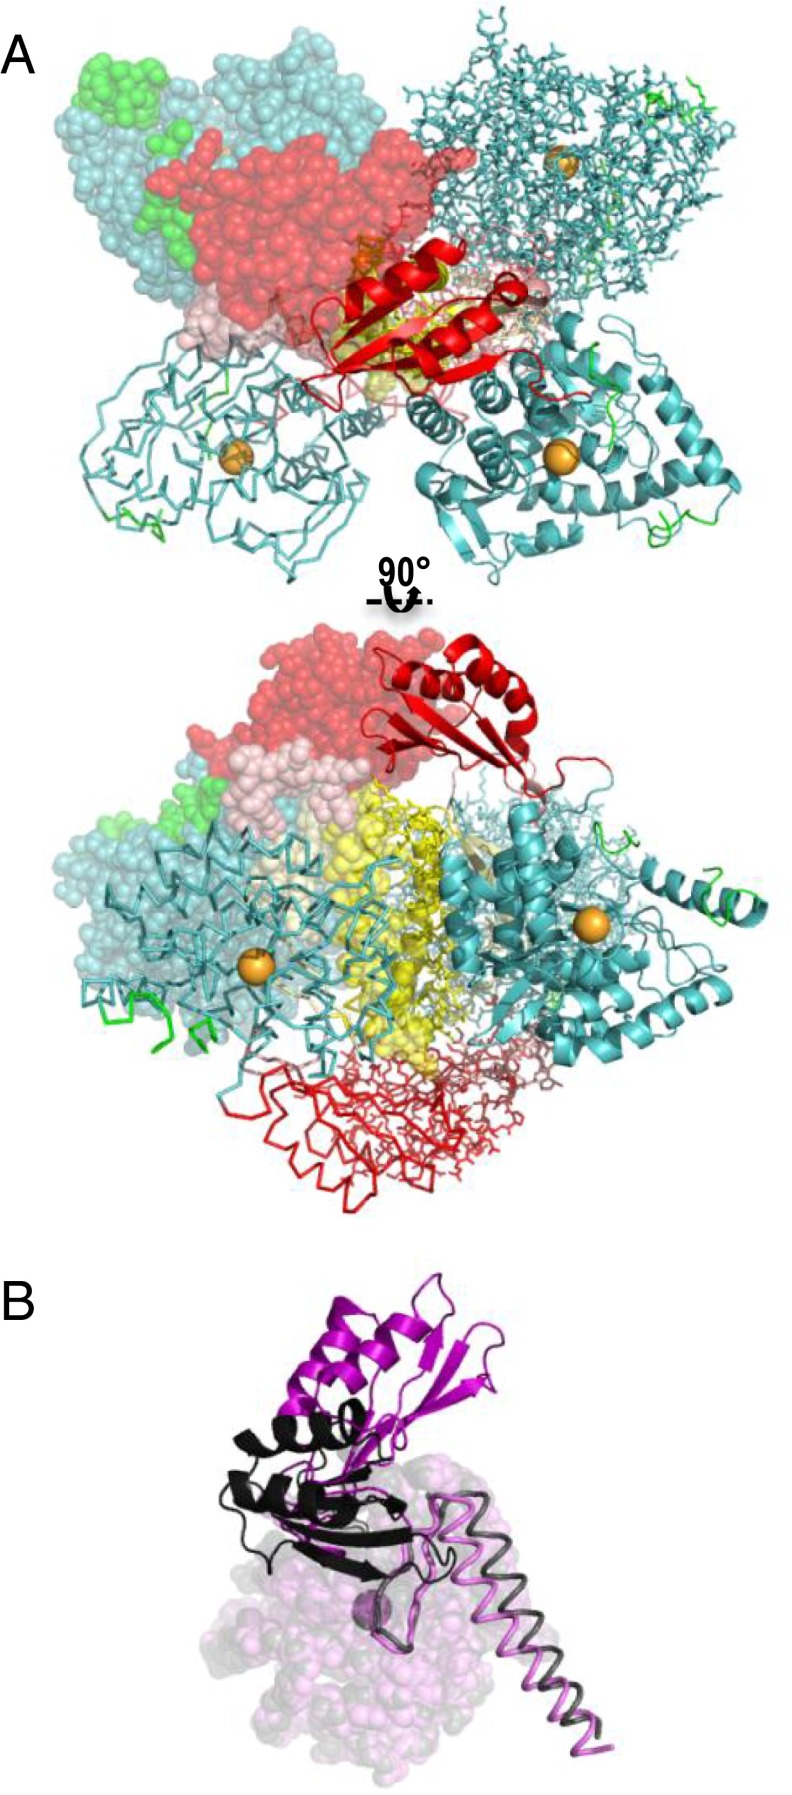
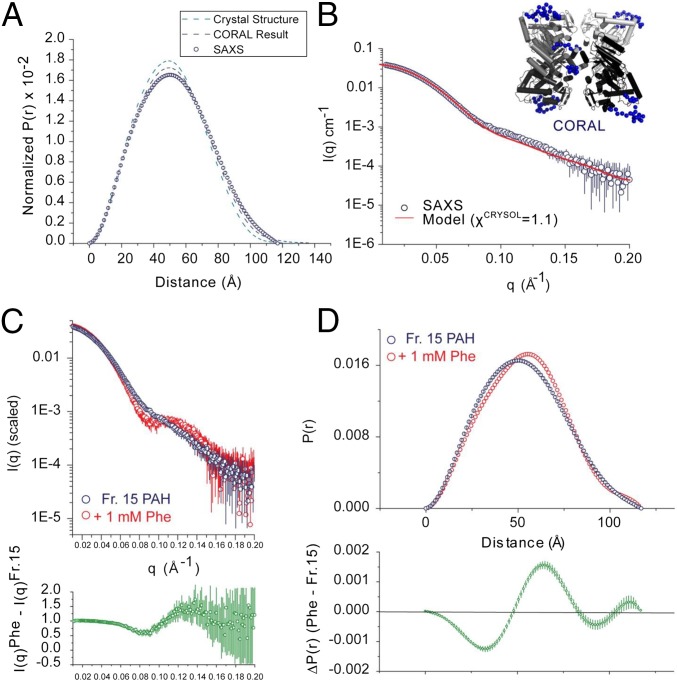
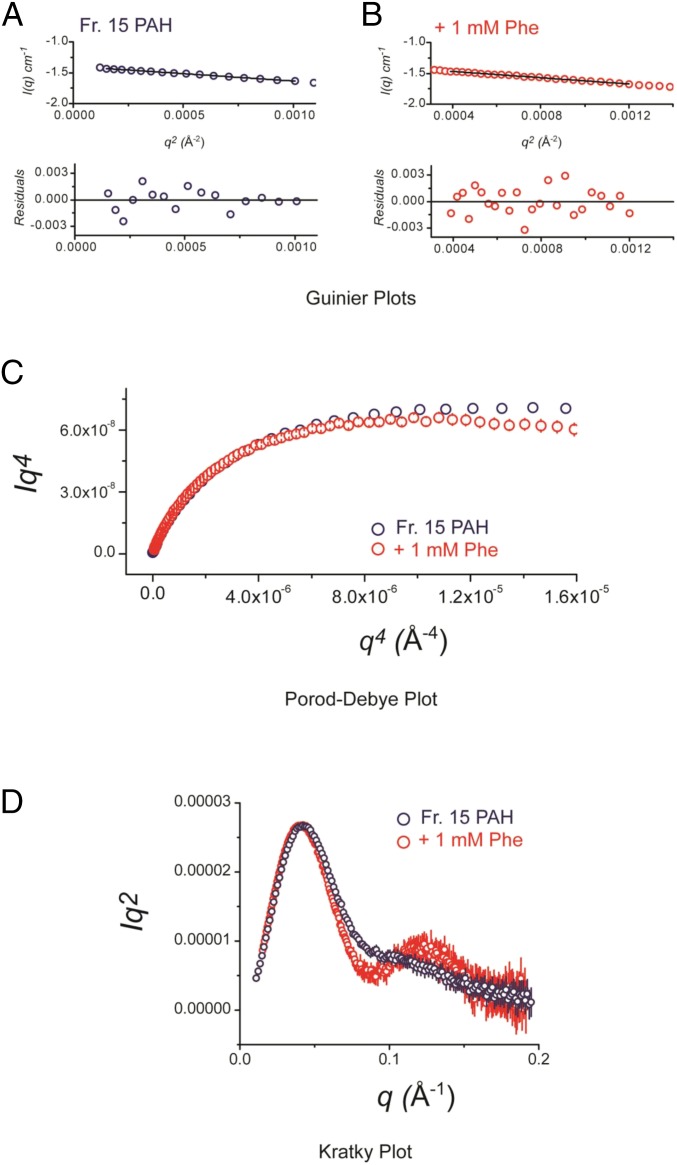
Improved understanding of the relationship among structure, dynamics, and function for the enzyme phenylalanine hydroxylase (PAH) can lead to needed new therapies for phenylketonuria, the most common inborn error of amino acid metabolism. PAH is a multidomain homo-multimeric protein whose conformation and multimerization properties respond to allosteric activation by the substrate phenylalanine (Phe); the allosteric regulation is necessary to maintain Phe below neurotoxic levels. A recently introduced model for allosteric regulation of PAH involves major domain motions and architecturally distinct PAH tetramers [Jaffe EK, Stith L, Lawrence SH, Andrake M, Dunbrack RL, Jr (2013) Arch Biochem Biophys 530(2):73-82]. Herein, we present, to our knowledge, the first X-ray crystal structure for a full-length mammalian (rat) PAH in an autoinhibited conformation. Chromatographic isolation of a monodisperse tetrameric PAH, in the absence of Phe, facilitated determination of the 2.9 Å crystal structure. The structure of full-length PAH supersedes a composite homology model that had been used extensively to rationalize phenylketonuria genotype-phenotype relationships. Small-angle X-ray scattering (SAXS) confirms that this tetramer, which dominates in the absence of Phe, is different from a Phe-stabilized allosterically activated PAH tetramer. The lack of structural detail for activated PAH remains a barrier to complete understanding of phenylketonuria genotype-phenotype relationships. Nevertheless, the use of SAXS and X-ray crystallography together to inspect PAH structure provides, to our knowledge, the first complete view of the enzyme in a tetrameric form that was not possible with prior partial crystal structures, and facilitates interpretation of a wealth of biochemical and structural data that was hitherto impossible to evaluate.

Keywords: X-ray crystallography; allosteric regulation; phenylalanine hydroxylase; phenylketonuria; small-angle X-ray scattering.


Conflict of interest statement

The authors declare no conflict of interest.

Figures

Fig. 1.
Fig. 1.
The structure of PAH. (A) The annotated domain structure of mammalian PAH. (B) The 2.9 Å PAH crystal structure in orthogonal views, colored as in part A, subunit A is shown in ribbons; subunit B is as a Cα trace; subunit C is in sticks; and subunit D is in transparent spheres. In cyan, the subunits are labeled near the catalytic domain (Top); in red, they are labeled near the regulatory domain (Bottom). The dotted black circle illustrates the autoregulatory domain partially occluding the enzyme active site (iron, in orange sphere). (C) Comparison of the subunit structures of full-length PAH and those of the composite homology model; the subunit overlay aligns residues 144–410. The four subunits of the full-length PAH structure (the diagonal pairs of subunits are illustrated using either black or white) are aligned with the two subunits of 2PAH (cyan) and the one subunit of 1PHZ (orange). The catalytic domain is in spheres, the regulatory domain is in ribbons, and the multimerization domain is as a Cα trace. The arrow denotes where the ACT domain and one helix of 2PAH conflict.
Fig. S1.
Fig. S1.
Ion exchange resolution of PAH assemblies. Rat PAH (28 mg), which is homogeneous by SDS/PAGE (12), is separated into different quaternary structure species using a 1-mL Hi-Trap Q column and a salt gradient. Native PAGE (PhastSystem) on individual fractions shows partial resolution of two tetrameric species and one dimeric species stained using Coomassie blue; a native Western blot shows the identical pattern of bands, with additional intensity in the dimeric species [as seen before (12)]. Fraction 15, or its equivalent from other preparations, was used for the crystallography and SAXS studies.
Fig. 2.
Fig. 2.
Overall architectures of PAH and related structures. (A) Structure of full-length PAH showing that subunits with similar structures (white like white, black like black) are positioned across the diagonal of the tetramer, when viewed from the perspective of the catalytic domains (Top). The regulatory domains of these similarly structured subunits are on the same side of the tetramer (Bottom). These are the subunits for which the predicted ACT domain dimerization would occur in formation of the Phe-stabilized allosterically activated tetramer. (B) The two-domain PAH tetramer (2PAH, dimer in the asymmetric unit, one white, one black), is assembled with identical subunits adjacent along the short edge of the tetramer (from the perspective of the catalytic domains). (C) The two-domain structure of tyrosine hydroxylase (1TOH, monomer in the asymmetric unit) is symmetric. (D) Representation of full-length PAH, similar to part A, showing selected distances to illustrate the asymmetry of the tetramer. (E) The 2.9 Å structure (cyan), overlaid on two other, lower resolution, structures of full-length PAH [resolutions, 3.1 Å (black) and 3.9 Å (magenta)]. The B subunits of the three structures were superposed.
Fig. 3.
Fig. 3.
Insight into what controls the configuration of the PAH active-site lid. (A–C) Space filling images of the catalytic domains of PAH structures colored as in Fig. 1A, with the active site (within 10 Å of the iron ion, shown as an orange sphere) colored white and active-site ligands in sticks colored by element. In all open structures, the RMS deviation between Cα positions in this lid is 0.3 Å; the corresponding value for closed structures is 0.2 Å. The highest resolution examples are used for illustration. (A) 1PAH contains only iron in the active site; (B) 1J8U contains iron and BH4; (C) 1MMT contains iron, BH4, and norleucine. (D) Positioned and colored as per parts A–C is the current crystal structure subunit D, which contains only iron in the active site. (E) An overlay of 1J8U (open, green) and 1MMT (closed, magenta) on residues 144–410 of subunit D of the current structure (disordered, gray) helps illustrate the various lid conformations. The coloring on part E corresponds to the coloring used in Table S1.
Fig. S2.
Fig. S2.
One model for an activated PAH tetramer that can be stabilized by allosteric Phe binding. (A) Orthogonal illustrations of a PAH composite tetramer model containing an ACT domain dimer interface between two subunits positioned across the diagonal of the tetramer. The putative position of the allosteric Phe binding site is within this ACT domain dimer interface. Although there is ample evidence supporting Phe stabilizing a dimerized PAH ACT domain (27, 29, 45), the details of the ACT domain dimer interface, the positioning of the C-terminal helices, which determines the relative orientations of the catalytic domains, and the conformation of the autoregulatory region can be modeled in alternate ways. Here, the catalytic and multimerization domains are modeled on the symmetric two-domain tetrameric structure of tyrosine hydroxylase (PDB ID code 1TOH, Fig. 2C) combined with our previously published PAH ACT domain dimer model (12). The program YASARA (46) was used to “refold” residues 19–33. (B) A subunit overlay (like Fig. 1C) of one subunit of the current structure (gray/black) with one subunit of a PAH model of the activated protein (light magenta/magenta). In comparing these structures, the regulatory domain, shown in a darker shade, is rotated 90° relative to the catalytic domain; this rotation relieves the conflict with the C-terminal helix (arrow in Fig. 1C).
Fig. S3.
Fig. S3.
Normalized B factors for wild-type PAH structures, where the active-site lid (residues 130–150) is marked with a solid green line. B-factor values were normalized using the average B factor for each structure.
Fig. S4.
Fig. S4.
Possible alternate side chain positions at Phe131. (A) Superposition of the human PAH catalytic domain structure (PDB ID code 1J8U, yellow) and chain A of full-length rat PAH (PDB ID code 5DEN, magenta). This stereoview shows the vicinity of Phe131. Note that Arg111 is not present in the model for the catalytic domain structure. (B) Stereoview of a portion of the 2mFo-DFc weighted electron density map for 1J8U, contoured at 1.4σ (RMS). This map was calculated with the deposited 1J8U structure factors, using the Uppsala Electron Density Server (eds.bmc.uu.se/eds/) (47). Residues 130–135 are shown in yellow for the 1J8U catalytic domain structure; for comparison, the positions of Phe131 and Gln134 from the superimposed 5DEN model are shown in magenta. Additional density is seen to the Right of the modeled position for Phe131, which overlaps the side-chain position of Phe131 in the 5DEN structure. In the 1J8U model, the position of the Gln134 side chain would prevent Phe131 from adopting this alternate conformer, but in 5DEN the side chain of Gln134 moves down and away, removing this obstacle. (C) Stereoview of a portion of the composite iterative-build omit map generated from the 5DEN data, contoured at 0.75σ (RMS). Residues 130–135 are shown in magenta for the 5DEN full-length rat structure; for comparison, the positions of Phe131 and Gln134 from the superimposed 1J8U model are shown in yellow. The viewpoints for A–C are approximately the same.
Fig. S5.
Fig. S5.
Important interdomain interactions (colored as Fig. 1A). (A) Interactions of a hinge between the ACT subdomain (Lys113), the catalytic domain (Asp315), and a residue in the autoregulatory segment (Asp27). (B) There is a single interdomain intrachain interaction composed of two energetically favorable cation–π interactions that engages all three domains (44). (C) The autoregulatory segment (Asn30) interacts with the active-site lid via Gln134, whereas Phe131 is poised to engage in an energetically favorable cation–π interaction with Arg111 in the ACT subdomain.
Fig. 4.
Fig. 4.
SAXS analyses. SAXS data obtained on the PAH tetramers in the absence of Phe is illustrated in parts A and B, and compared with the data in the presence of 1 mM Phe in parts C and D. (A) The pairwise shape distribution function [P(r)] for isolated PAH in the absence of Phe (blue circles). (B) A log–log plot (log I vs. log q) is a representative fit from CORAL rigid-body refinement (red line) vs. the experimental SAXS data (black circles) for PAH in the absence of Phe. In B and C, error bars represent the combined standard uncertainty of the data collection. A representative SAXS-refined CORAL structure is shown (Inset). The fixed atomic inventory from the crystal structure is gray, and the modeled inventory is as blue spheres. (C) A comparison of PAH before and after incubation with 1 mM Phe is shown as a superposed log–log plot (log I vs. log q) of PAH before (blue) and after (red). Using a modified χ2 (34), the Fr. 15 (-Phe) SAXS data shows a discrepancy of 0.9 vs. the crystal structure, whereas in the presence of 1 mM Phe this discrepancy increases to 2.2. Using the more discerning volatility of ratio metric [Vr, where identity is 0 and larger figures indicate higher discrepancy (34)], the Fr. 15 SAXS data show similar concordance to the structure (Vr = 4.4), whereas in the 1 mM Phe state this discrepancy increase significantly (Vr = 10.9). Shown below is a ratio plot (green), revealing discrepancy between the two profiles as a function of q; identical regions will have a ratio value of ∼1, whereas regions of higher discrepancy will have values that deviate from unity. Errors shown represent propagated counting statistics. (D) The shape distributions determined for rat PAH in the absence (blue circles) and presence (red circles) of 1 mM Phe. In the lower panel is ΔP(r) analysis (green); errors represent propagated errors from the initial inverse Fourier transform.
Fig. S6.
Fig. S6.
Supporting SAXS analysis. (A and B) Shown is Guinier plots analyses [ln (I) vs. q2] of PAH as isolated (A, blue) or after incubation with 1 mM Phe (B, red), with residuals from the fitting shown below the respective fits. Plots were linear and indicative of monodisperse samples. All of the preparations analyzed were monodisperse, as evidenced by linearity in the Guinier region of the scattering data and agreement of the I(0) and Rg values determined with inverse Fourier transform analysis by the programs GNOM (48). Guinier analyses were performed where qRg ≤ 1.4. When fitting manually, the maximum diameter of the particle (Dmax) was manually adjusted in GNOM to maximize the goodness-of-fit parameter, to minimize the discrepancy between the fit and the experimental data, and the visual qualities of the distribution profile. Mass determinations using the Qr invariant were determined using the program ScÅtter (https://bl1231.als.lbl.gov/scatter/). Parameters derived from this analysis are provided in Tables S3 and S4, including Rg, I(0), and the qRg range used for fitting. (C) A Porod–Debye analysis shows a plateau in the profile as a function of q4, which indicates general compactness, whereas a deviation from this asymptote as a function of q4 would indicate a loss of compactness (28) Both profiles present as compact particles, with a further gain in compactness occurring in the presence of ligand. This suggests that the Phe-stabilized conformation is not due to significant differences in flexibility and disorder, but rather discrete differences in the configurations of structural domains. (D) A Kratky plot analysis provides qualitative views of the degree of compaction of a biopolymer. For a well-folded macromolecule, a distinct peak feature at low scattering angle is typically observed, followed by a return to baseline. Unfolded biopolymers lack these features, instead increasing systematically with scattering angle. In this analysis, compact structure is indicated, consistent with the Porod–Debye analysis. In all cases, error bars on the scattering profiles represent the combined standard uncertainty of the data collection and are propagated throughout; at the lowest recorded scattering angles, this error is ∼1%.

References

    1. Flydal MI, Martinez A. Phenylalanine hydroxylase: Function, structure, and regulation. IUBMB Life. 2013;65(4):341–349. - PubMed
    1. Fitzpatrick PF. Mechanism of aromatic amino acid hydroxylation. Biochemistry. 2003;42(48):14083–14091. - PMC - PubMed
    1. Kaufman S. The phenylalanine hydroxylating system. Adv Enzymol Relat Areas Mol Biol. 1993;67:77–264. - PubMed
    1. Roberts KM, Pavon JA, Fitzpatrick PF. Kinetic mechanism of phenylalanine hydroxylase: Intrinsic binding and rate constants from single-turnover experiments. Biochemistry. 2013;52(6):1062–1073. - PMC - PubMed
    1. Fitzpatrick PF. Allosteric regulation of phenylalanine hydroxylase. Arch Biochem Biophys. 2012;519(2):194–201. - PMC - PubMed

Publication types

Associated data