

Reclassification of genetic-based risk predictions as GWAS data accumulate
- PMID: 26884246
- PMCID: PMC4756503
- DOI: 10.1186/s13073-016-0272-5
Reclassification of genetic-based risk predictions as GWAS data accumulate
Abstract
Background: Disease risk assessments based on common genetic variation have gained widespread attention and use in recent years. The clinical utility of genetic risk profiles depends on the number and effect size of identified loci, and how stable the predicted risks are as additional loci are discovered. Changes in risk classification for individuals over time would undermine the validity of common genetic variation for risk prediction. In this analysis, we quantified reclassification of genetic risk based on past and anticipated future GWAS data.
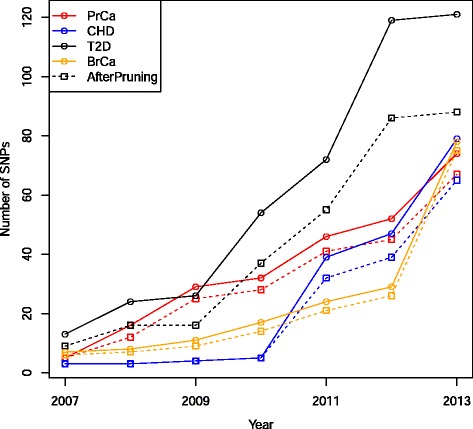
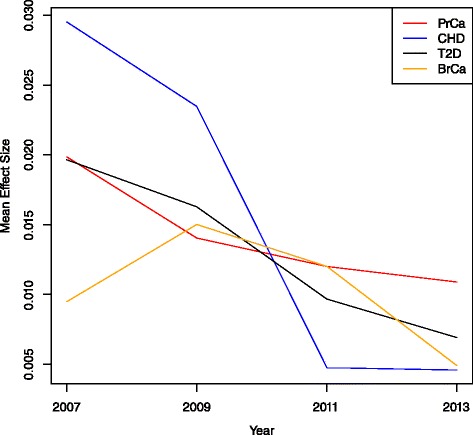
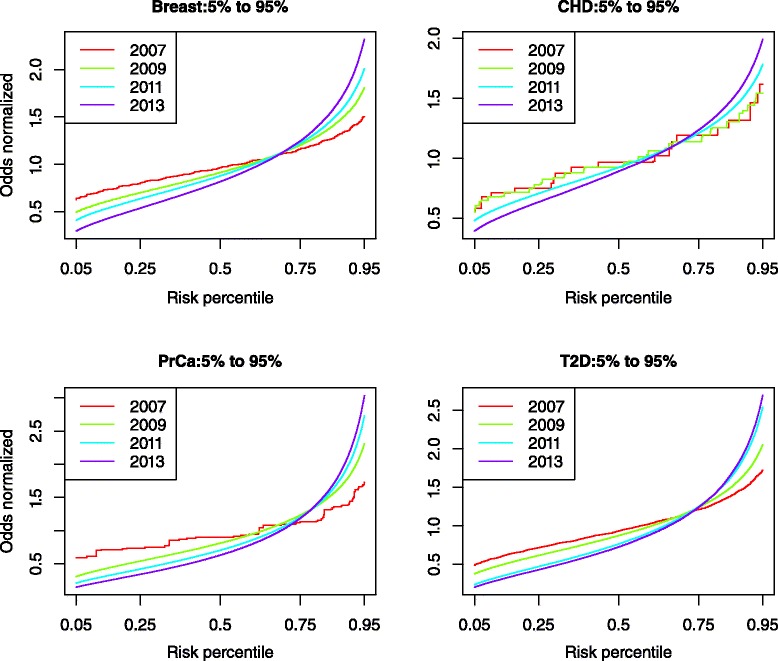
Methods: We identified disease-associated SNPs via the NHGRI GWAS catalog and recent large scale genome-wide association study (GWAS). We calculated the genomic risk for a simulated cohort of 100,000 individuals based on a multiplicative odds ratio model using cumulative GWAS-identified SNPs at four time points: 2007, 2009, 2011, and 2013. Individuals were classified as Higher Risk (population adjusted odds >2), Average Risk (between 0.5 and 2), and Lower Risk (<0.5) for each time point and we compared classifications between time points for breast cancer (BrCa), prostate cancer (PrCa), diabetes mellitus type 2 (T2D), and cardiovascular heart disease (CHD). We estimated future reclassification using the anticipated number of undiscovered SNPs.
Results: Risk reclassification occurred for all four phenotypes from 2007 to 2013. During the most recent interval (2011-2013), the degree of risk reclassification ranged from 16.3 % for CHD to 24.4 % for PrCa. Many individuals classified as Higher Risk at earlier time points were subsequently reclassified into a lower risk category. From 2011 to 2013, the degree of such downward risk reclassification ranged from 24.9% for T2D to 55% for CHD. The percent of individuals classified as Higher Risk increased as more SNPs were discovered, ranging from an increase of 5% for CHD to 9% for PrCa from 2007 to 2013. Reclassification continued to occur when we modeled the discovery of anticipated SNPs based on doubling current sample size.
Conclusion: Risk estimates from common genetic variation show large reclassification rates. Identifying disease-associated SNPs facilitates the clinically relevant task of identifying higher-risk individuals. However, the large amount of reclassification that we demonstrated in individuals initially classified as Higher Risk but later as Average Risk or Lower Risk, suggests that caution is currently warranted in basing clinical decisions on common genetic variation for many complex diseases.
Figures
References
Publication types
MeSH terms
Grants and funding
LinkOut - more resources
Full Text Sources
Other Literature Sources
Miscellaneous
