. 2016 Apr;170(4):2204-17.
doi: 10.1104/pp.15.01853. Epub 2016 Feb 16.

A Medicago truncatula Cystathionine-β-Synthase-like Domain-Containing Protein Is Required for Rhizobial Infection and Symbiotic Nitrogen Fixation

Affiliations

A Medicago truncatula Cystathionine-β-Synthase-like Domain-Containing Protein Is Required for Rhizobial Infection and Symbiotic Nitrogen Fixation

Senjuti Sinharoy et al. Plant Physiol. 2016 Apr.

Abstract

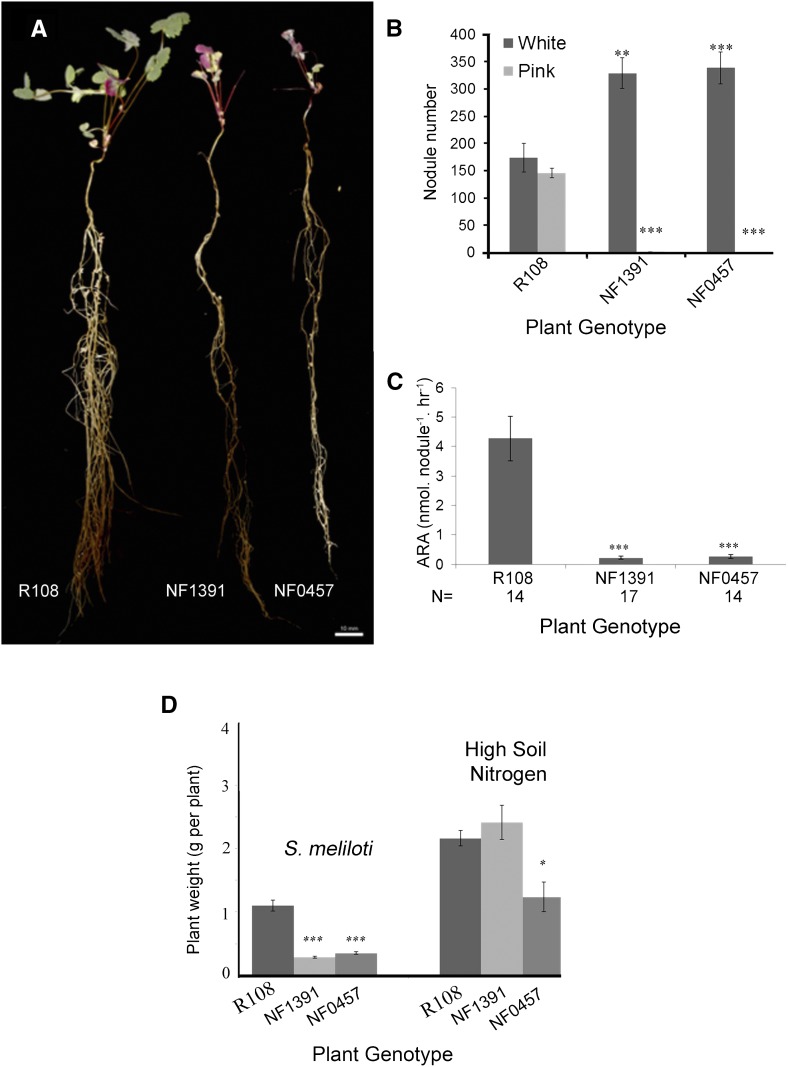
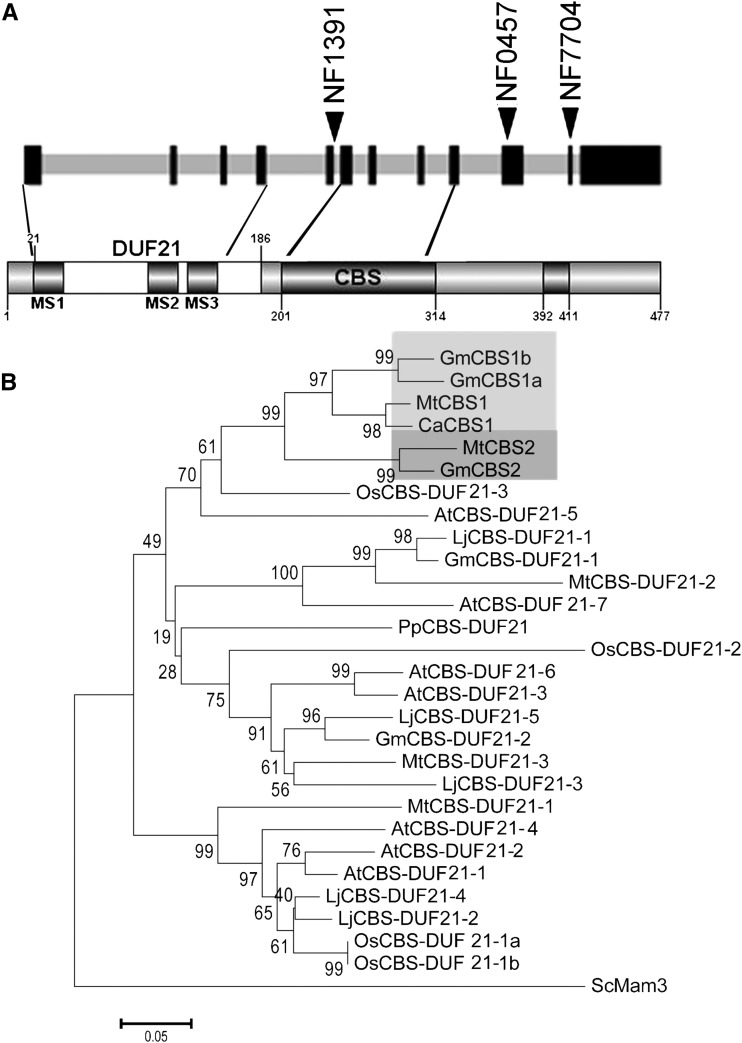
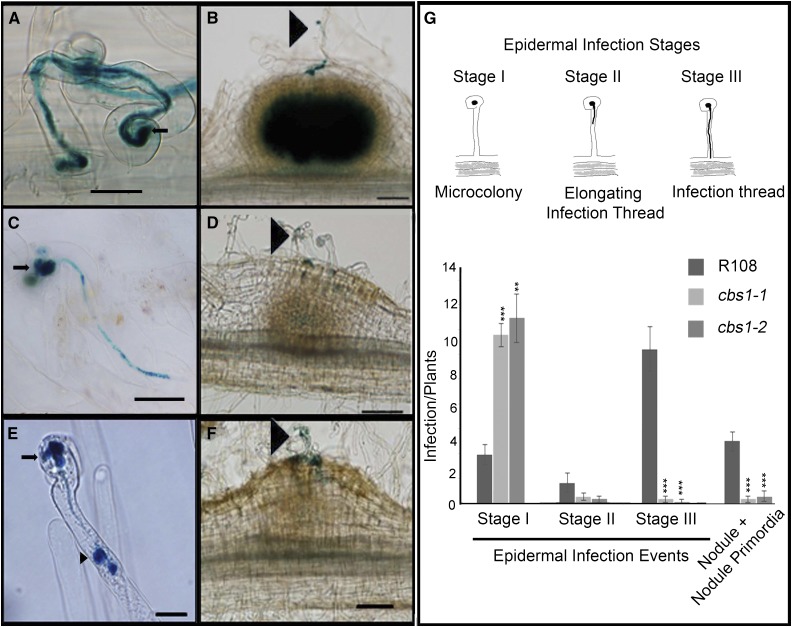
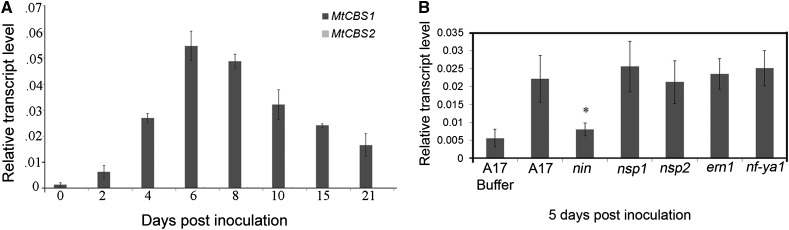
The symbiosis between leguminous plants and soil rhizobia culminates in the formation of nitrogen-fixing organs called nodules that support plant growth. Two Medicago truncatula Tnt1-insertion mutants were identified that produced small nodules, which were unable to fix nitrogen effectively due to ineffective rhizobial colonization. The gene underlying this phenotype was found to encode a protein containing a putative membrane-localized domain of unknown function (DUF21) and a cystathionine-β-synthase domain. The cbs1 mutants had defective infection threads that were sometimes devoid of rhizobia and formed small nodules with greatly reduced numbers of symbiosomes. We studied the expression of the gene, designated M truncatula Cystathionine-β-Synthase-like1 (MtCBS1), using a promoter-β-glucuronidase gene fusion, which revealed expression in infected root hair cells, developing nodules, and in the invasion zone of mature nodules. An MtCBS1-GFP fusion protein localized itself to the infection thread and symbiosomes. Nodulation factor-induced Ca(2+) responses were observed in the cbs1 mutant, indicating that MtCBS1 acts downstream of nodulation factor signaling. MtCBS1 expression occurred exclusively during Medicago-rhizobium symbiosis. Induction of MtCBS1 expression during symbiosis was found to be dependent on Nodule Inception (NIN), a key transcription factor that controls both rhizobial infection and nodule organogenesis. Interestingly, the closest homolog of MtCBS1, MtCBS2, was specifically induced in mycorrhizal roots, suggesting common infection mechanisms in nodulation and mycorrhization. Related proteins in Arabidopsis have been implicated in cell wall maturation, suggesting a potential role for CBS1 in the formation of the infection thread wall.


Figures

Figure 1.
Figure 1.
Nodulation, nitrogen fixation, and growth phenotypes of the wild-type (R108), and NF1391 and NF0457 mutants. A, Plant growth 21 dpi with S. meliloti 1021. Wild type on left, followed by NF1391 and NF0457. B, Number of pink and white nodules at 70 dpi with S. meliloti 1021, n = 9. C, ARA of wild-type R108 and mutants at 21 dpi, n = 14–17. D, Plant fresh weights for wild-type and mutants grown with low nitrogen (0.5 mm nitrate supplied once) and inoculated with S. meliloti 1021 and harvested at 21 dpi, or supplemented with 2 mm each of KNO3 and NH4NO3 each week. Plants were harvested at 28 d post-planting, n = 11. Bars indicate ± se. Asterisks indicate a significant difference in plant performance with respect to the R108 control, determined using Student’s t test: *P ≤ 0.05, **P ≤ 0.01, and ***P ≤ 0.001. ARA, acetylene reduction activity.
Figure 2.
Figure 2.
MtCBS1 contains a predicted membrane-spanning domain of unknown function (DUF21) and a single cystathionine-β-synthase domain. A, Schematic representation of MtCBS1 gene structure (top) and conserved domains of the corresponding protein (bottom). Exons are represented by black rectangular boxes and introns with gray. Two domains (DUF21 and CBS) are indicated on the protein representation. The positions of the Tnt1 insertion sites for the different cbs1 alleles are indicated by arrowheads on the MtCBS1 gene structure. Three putative membrane-spanning domains (MS1–3) are predicted by the TopPred 1.10 program (http://mobyle.pasteur.fr/cgi-bin/portal.py#forms::toppred) and marked as gray boxes along the protein; the numbers are amino-acid positions in the protein. B, Phylogeny of the MtCBS1-DUF21. Arabidopsis (At), C. arietinum (Ca), G. max (Gm), L. japonicus (Lj), M. truncatula (Mt), O. sativa (Os), P. patens (Pp), and S. cerevisiae (Sc). The bar represents the estimated amino-acid change per sequence position. The S. cerevisiae protein (CAY86228) is used to root the tree.
Figure 3.
Figure 3.
Infection defects of cbs1-1 and cbs1-2 mutants at early stages of interaction with S. meliloti 1021. A, B, Wild-type (R108); C, D, cbs1-1; and E, F, cbs1-2. Representative micrographs of infection phenotypes; the presence of S. meliloti is visualized by β-Gal blue-staining. A, C, and E, Epidermal infection threads. C, E, Mutants have a large microcolony (marked by arrows) and halted IT (marked by arrow head), respectively. B, D, and F, Nodule formation was observed 7 dpi (ITs are marked by arrowheads). G, Average number of microcolonies, elongating ITs, full length or cortical ITs, and cortical events (nodules plus nodule primordia) in wild-type and mutant plants within 2.5 cm of the susceptible zone of the root at 7 dpi visualized using lacZ-expressing S. meliloti 1021. Mean ± se from n = 17 (R108), 11 (Mtcbs1-1), and 10 (Mtcbs1-2) plants. Asterisks indicate a significant difference by Student’s t test: *P ≤ 0.05, **P ≤ 0.01, and ***P ≤ 0.001. Scale bar, A, C, and E, 20 μm; B, D, and F, 100 μm.
Figure 4.
Figure 4.
Infection phenotype of Mtcbs1. Confocal micrographs of rhizobial infection showing GFP-labeled S. meliloti 1021 (green); root hair and IT cell wall was stained with calcofluor white (blue, which binds to β-1,3 and β-1,4 polysaccharides) to monitor growth of the IT. A, B, C, wild type; D, E, F, cbs1-1; G, H, I, cbs1-2. Scale bar 10 μm. Empty ITs were marked by arrows. (I) The microcolony and empty IT are from two different root hair cells. The erratic deposition of IT walls are marked by arrows.
Figure 5.
Figure 5.
Cytological characterization of cbs1 mutant nodules during bacterial endocytosis. Semi-thin section of 11-dpi-old whole nodule from A, wild-type and B, cbs1-2 were stained with toluidine blue. High magnification light microscopic images from ZII of wild-type (C) and cbs1-2 (D) in an 11-dpi nodule showing defects in bacterial release from ITs in cbs1-2 nodules. High magnification light microscopic images from ZIII of wild type (E) and cbs1-2 (F). TEM images from ZIII wild type (G) and cbs1-2 (H) nodule cells at 11 dpi, showing symbiosomes. Note the low bacterial occupancy of infected cells in the mutant (compare E and G with F and H). M, meristem; V, vascular bundle; ZII, invasion zone; ZIII nitrogen fixation zone; S, starch granule. ITs are indicated by arrows, and degrading bodies are indicated by arrowheads. Scale bar: A, B, 20 μm; C, D, 10 μm.
Figure 6.
Figure 6.
Expression patterns of CBS1 during nodule development. X-Gluc (blue) staining for promCBS1:GUS expression and Magenta-Gal (purple) staining for lacZ S. meliloti infection were used. A, Root hairs in the infection zone, 3 dpi. GUS-stained ITs are indicated by arrows; B, a curled root hair cell shows GUS activity. C, A curled root hair cell containing an IT and the base of the root hair cell shows GUS activity. The IT is marked with an arrowhead. D, A dividing cortical cell shows GUS activity at 3 dpi and the associated infection event is shown by rhizobia Magenta-Gal staining and marked with an arrowhead. E, F, Developing nodule primordia show GUS activity associated with the invasion zone (6 dpi). G, H, I, The 15-dpi nodule shows that GUS activity is mainly associated with meristem and invasion zone; G, brief GUS staining for 3 h; H, section of nodule after GUS staining; I, GUS-stained sections of mature nodules were further counterstained with Magenta-Gal, which shows GUS activity associated with the meristem and invasion zones, with some staining in the nodule cortex. Bars represent A, F, H, I, 100 μm; B, C, D, 20 μm; E, 50 μm; and G, 1 mm. V, Vascular bundle; M, meristem; Ep, epidermis; Ed, endodermis; C1–C5, numbering of cortical cell layers of Medicago root from outside to inside according to Xiao et al. (2014).
Figure 7.
Figure 7.
CBS1 expression is induced during nodulation and under the control of NIN. A, Expression profile of CBS1 and CBS2 during nodule development in M. truncatula ecotype R108. qRT-PCR was used to measure CBS1 and CBS2 transcript levels relative to three housekeeping genes [MtPI4K (Medtr3g091400), MtPTB2 (Medtr3g090960), and MtUBC28 (Medtr7g116940)] in the infection-susceptible zone of roots (0–4 dpi) and in developing nodules (6–21 dpi). The mean of three biological replicates is presented in each case. Vertical bars represent ± sd. B, qRT-PCR analysis of isolated root hair cells from wild-type A17 and five transcription factor mutants (nin, nsp1, nsp2, ern1, and hap2.1) in the A17 background at 5 dpi with S. meliloti. Mean and sd (vertical bars) of three biological replicates are presented in each case. Asterisks indicate a significant difference in CBS1 expression with respect to the control by Student’s t test: * P ≤ 0.05.
Figure 8.
Figure 8.
CBS1-GFP localizes to ITs and symbiosomes. A, with mCherry-expressing S. meliloti 1021 (red) in a brightest-point projection of a spinning disk confocal stack merged (1), GFP only (2), and mCherry only (3). B, A merged field of a single z-section showing the CBS1:GFP (green) along the IT matrix, S. meliloti 1021 (red). C, D, E, F, G, promCBS1-driven CBS1:GFP (green) localization in the infection zone 12 dpi with S. meliloti 1021 (red). C, D, Brightest-point projection of a spinning disk confocal stack, shows CBS1:GFP protein localization around bacteroids. D, GFP-only field of (C). E, F, G, Higher-magnification micrograph showing CBS1:GFP protein localized to the symbiosome space. E, F, Merged field. G, The GFP-only field showing the CBS1:GFP localization in the symbiosome space. Arrows indicate localization of the CBS1:GFP protein. A, B, C, D, E, Scale bar = 10 μm; F, G, scale bar = 5 μm.

References

    1. Andrio E, Marino D, Marmeys A, de Segonzac MD, Damiani I, Genre A, Huguet S, Frendo P, Puppo A, Pauly N (2013) Hydrogen peroxide-regulated genes in the Medicago truncatula-Sinorhizobium meliloti symbiosis. New Phytol 198: 179–189 - PubMed
    1. Ané JM, Kiss GB, Riely BK, Penmetsa RV, Oldroyd GE, Ayax C, Lévy J, Debellé F, Baek JM, Kaló P, Rosenberg C, Roe BA, et al. (2004) Medicago truncatula DMI1 required for bacterial and fungal symbioses in legumes. Science 303: 1364–1367 - PubMed
    1. Arrighi JF, Barre A, Ben Amor B, Bersoult A, Soriano LC, Mirabella R, de Carvalho-Niebel F, Journet EP, Ghérardi M, Huguet T, Geurts R, Dénarié J, et al. (2006) The Medicago truncatula lysin [corrected] motif-receptor-like kinase gene family includes NFP and new nodule-expressed genes. Plant Physiol 142: 265–279 - PMC - PubMed
    1. Arrighi JF, Godfroy O, de Billy F, Saurat O, Jauneau A, Gough C (2008) The RPG gene of Medicago truncatula controls Rhizobium-directed polar growth during infection. Proc Natl Acad Sci USA 105: 9817–9822 - PMC - PubMed
    1. Bateman A. (1997) The structure of a domain common to archaebacteria and the homocystinuria disease protein. Trends Biochem Sci 22: 12–13 - PubMed

Publication types

MeSH terms