. 2016 Feb 10;9(Suppl 2):37-42.
doi: 10.4137/BBI.S30524. eCollection 2015.

Visualization of Genome Diversity in German Shepherd Dogs

Affiliations

Visualization of Genome Diversity in German Shepherd Dogs

Sally-Anne Mortlock et al. Bioinform Biol Insights. .

Abstract

A loss of genetic diversity may lead to increased disease risks in subpopulations of dogs. The canine breed structure has contributed to relatively small effective population size in many breeds and can limit the options for selective breeding strategies to maintain diversity. With the completion of the canine genome sequencing project, and the subsequent reduction in the cost of genotyping on a genomic scale, evaluating diversity in dogs has become much more accurate and accessible. This provides a potential tool for advising dog breeders and developing breeding programs within a breed. A challenge in doing this is to present complex relationship data in a form that can be readily utilized. Here, we demonstrate the use of a pipeline, known as NetView, to visualize the network of relationships in a subpopulation of German Shepherd Dogs.

Keywords: German Shepherd Dog; diversity; genome.


Figures
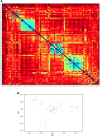
Figure 1
Figure 1
Representation of the genetic relationship between dogs using molecular data. (A) Heat map produced by NetView (Spin) depicting a relationship matrix of the GSD. Individual genetic SNP values are represented as colors contained in the matrix. The presence of three population clusters is evident in light blue coloring. (B) Genotyping data demonstrating relationships as represented in a two-dimensional MDS plot.
Figure 2
Figure 2
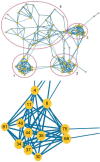
Network visualization graph produced by Cytoscape depicting the genetic relationships and degree of relatedness between individual GSDs based on SNP data. Individuals are represented as nodes and lines between dogs represent relationships. (A) Three population clusters are evident due to colocation and thicker lines between related individuals, proportional to genetic distance. (B) An expanded view of one cluster showing the detail of individual relationships.

References

    1. Akey JM, Ruhe AL, Akey DT, et al. Tracking footprints of artificial selection in the dog genome. Proc Natl Acad Sci U S A. 2010;107(3):1160–5. - PMC - PubMed
    1. Vaysse A, Ratnakumar A, Derrien T, et al. Identification of genomic regions associated with phenotypic variation between dog breeds using selection mapping. PLoS Genet. 2011;7(10):e1002316. - PMC - PubMed
    1. Jansson M, Laikre L. Recent breeding history of dog breeds in Sweden: modest rates of inbreeding, extensive loss of genetic diversity and lack of correlation between inbreeding and health. J Anim Breed Genet. 2014;131(2):153–62. - PMC - PubMed
    1. Pedersen N, Liu H, Theilen G, Sacks B. The effects of dog breed development on genetic diversity and the relative influences of performance and conformation breeding. J Anim Breed Genet. 2013;130(3):236–48. - PubMed
    1. Bateson P, Nicholas FW, Sargan DR, Wade CM. Analysis of the canine genome and canine health: bridging a gap. Vet J. 2013;196(1):1–3. - PubMed

LinkOut - more resources