. 2016 Mar;105(3):1074-85.
doi: 10.1016/j.xphs.2015.12.018. Epub 2016 Feb 2.

Holographic Characterization of Protein Aggregates

Affiliations

Holographic Characterization of Protein Aggregates

Chen Wang et al. J Pharm Sci. 2016 Mar.

Abstract

We demonstrate how holographic video microscopy can be used to detect, count, and characterize individual micrometer-scale protein aggregates as they flow down a microfluidic channel in their native buffer. Holographic characterization directly measures the radius and refractive index of subvisible protein aggregates and offers insights into their morphologies. The measurement proceeds fast enough to build up population averages for time-resolved studies and lends itself to tracking trends in protein aggregation arising from changing environmental factors. Information on individual particle's refractive indexes can be used to differentiate protein aggregates from such contaminants as silicone droplets. These capabilities are demonstrated through measurements on samples of bovine pancreas insulin aggregated through centrifugation and of bovine serum albumin aggregated by complexation with a polyelectrolyte. Differentiation is demonstrated with samples that have been spiked with separately characterized silicone spheres. Holographic characterization measurements are compared with results obtained with microflow imaging and dynamic light scattering.

Keywords: biopharmaceuticals characterization; colloids; light scattering; microparticles; microscopy; particle size; protein aggregation.


Figures

Figure 1
Figure 1
Protein aggregates flowing down a microfluidic channel form holograms as they pass through a laser beam. A typical experimental hologram is reproduced as a grayscale image in the figure. Each hologram is recorded by a video camera and compared with predictions of the Lorenz-Mie theory to measure each aggregate’s radius, ap, and refractive index, np. The scatter plot shows experimental data for 3000 subvisible aggregates of bovine insulin, with each data point representing the properties of a single aggregate, and colors denoting the relative probability density ρ(ap,np) for observations in the (ap,np) plane.
Figure 2
Figure 2
(a) Scatter plot of radius ap and refractive index np obtained with holographic characterization of the 4-component stoichiometric colloidal mixture described in the Materials section. Results for 20,000 particles are plotted. Superimposed crosses indicate the manufacturer’s specification for each of the 4 populations. These results establish holographic characterization’s ability to differentiate particles by composition as well as by size. (b) Measured holograms of colloidal polystyrene spheres in water together with fits, demonstrating the range of particle sizes amenable to holographic characterization. These typical examples were obtained for spheres with radii ap = 0.237 μm (224 pixel × 224 pixel region of interest), 0.800 μm (356 pixel × 356 pixel), and 10.47 μm (608 pixel × 608 pixel). The fit to each hologram yields values for the particle’s radius, ap, and refractive index, np. Radial profiles, b(r), are obtained from these holograms and their fits by averaging the normalized intensity over angles around the center of each feature and are plotted as a function of distance r from the center of the feature. Experimental data are plotted as blue curves within shaded regions representing the measurement’s uncertainty at that radius. Fits are superimposed as orange curves and closely track the experimental data.
Figure 3
Figure 3
Influence of added salt on the measured distribution of the radius ap and refractive index np of BSA-PAH complexes. Each point in the scatter plots represents the properties of a single aggregate and is colored by the relative density of observations, ρ(ap,np). (a) BSA complexed with PAH in Tris buffer (1100 aggregates). (b) The same sample with 0.1 M NaCl (1200 aggregates). (c) and (d) present the projected relative size distributions, ρ(ap), from (a) and (b), respectively. Shaded regions represent the instrumental and statistical error.
Figure 4
Figure 4
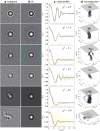
Influence of aggregate morphology on holographic characterization. Holograms of typical aggregates arranged in order of increasing discrepancy between measured and fit holograms. Column (a) shows 160 pixel × 160 pixel regions of interest from the microscope’s field of view, centered on features automatically identified as candidate BSA-PAH complexes. Column (b) shows fits to the Lorenz-Mie theory for holograms formed by spheres. Column (c) shows radial profiles of the experimental hologram (black curves) overlaid with the radial profile of the fits (red curves). Shaded regions represent the estimated experimental uncertainty. Column (d) shows Rayleigh-Sommerfeld reconstructions of the aggregates’ 3-dimensional structures obtained from the experimental holograms. Grayscale images are projections of the reconstructions, which resemble equivalent bright-field images at optimal focus. Superimposed circles indicate fit estimates for the particle size.
Figure 5
Figure 5
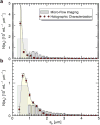
Comparison of size distributions measured with microflow imaging and holographic characterization. Each bin represents the number of particles per milliliter of solution in a range of ±100 nm about the bin’s central radius. (a) Sample without added salt from Figure 3a. (b) Same with added NaCl from Figure 3b.
Figure 6
Figure 6
Characterization of BSA-PAH complexes by dynamic light scattering (DLS). Values represent the percentage, P(ah), of the scattered light’s intensity due to scatterers of a given hydrodynamic radius, ah. The arrow indicates a small peak in both distributions around ah = 2.8μm.
Figure 7
Figure 7
Holographic characterization data for silicone spheres dispersed in deionized water. The gray-shaded region denotes the range of refractive indexes expected for these particles based on their composition. (a) Monodisperse sample (600 spheres). (b) Polydisperse sample (600 spheres).
Figure 8
Figure 8
Holographic measurement of the relative probability density, ρ(ap,np), of particle radius and refractive index for suspensions BSA-PAH complexes spiked with added silicone spheres. (a) Sample prepared under the same conditions as in Figure 3a spiked with the monodisperse spheres from Figure 7a (2000 features). (b) Sample prepared under the same conditions as in Figure 3b spiked with the polydisperse spheres from Figure 7b (1600 features). (c) and (d) show the projected relative probability density, ρ(ap), for particle radius from the data in (a) and (b), respectively.

References

    1. Food and Drug Administration. Guidance for Industry: Immunogenicity Assessment for Therapeutic Protein Products. Silver Spring, MD: U.S. Department of Health and Human Services; 2014.
    1. Schellekens H. Bioequivalence and the immunogenicity of biopharmaceuticals. Nat Rev Drug Discov. 2002;1:457–462. - PubMed
    1. Wang W. Protein aggregation and its inhibition in biopharmaceutics. Int J Pharm. 2005;289:1–30. - PubMed
    1. Carpenter JF, Randolph TW, Jiskoot W, et al. Overlooking subvisible particles in therapeutic protein products: gaps that may compromise product quality. J Pharm Sci. 2009;4:1201–1205. - PMC - PubMed
    1. Singh SK, Afonina N, Awwad M, et al. An industry perspective on the monitoring of subvisible particles as a quality attribute for protein therapeutics. J Pharm Sci. 2010;99:3302–3321. - PubMed

Publication types