Comparative Study
. 2016 Mar 31;531(7596):637-641.
doi: 10.1038/nature16994. Epub 2016 Feb 17.

The mid-developmental transition and the evolution of animal body plans

Affiliations
Comparative Study

The mid-developmental transition and the evolution of animal body plans

Michal Levin et al. Nature. .

Erratum in

  • Author Correction: The mid-developmental transition and the evolution of animal body plans.
    Levin M, Anavy L, Cole AG, Winter E, Mostov N, Khair S, Senderovich N, Kovalev E, Silver DH, Feder M, Fernandez-Valverde SL, Nakanishi N, Simmons D, Simakov O, Larsson T, Liu SY, Jerafi-Vider A, Yaniv K, Ryan JF, Martindale MQ, Rink JC, Arendt D, Degnan SM, Degnan BM, Hashimshony T, Yanai I. Levin M, et al. Nature. 2019 Nov;575(7782):E3. doi: 10.1038/s41586-019-1698-x. Nature. 2019. PMID: 31673121

Abstract

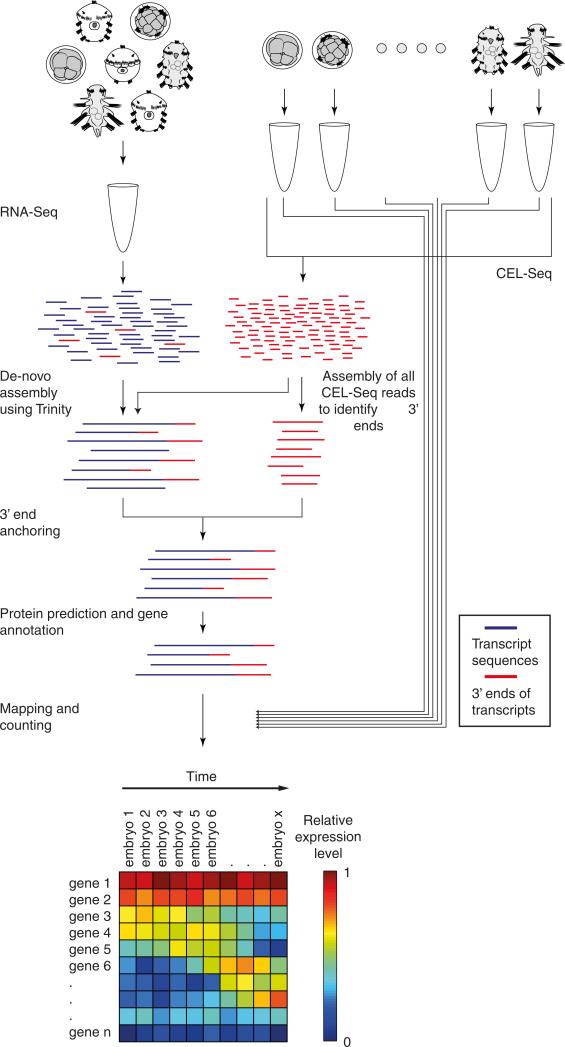
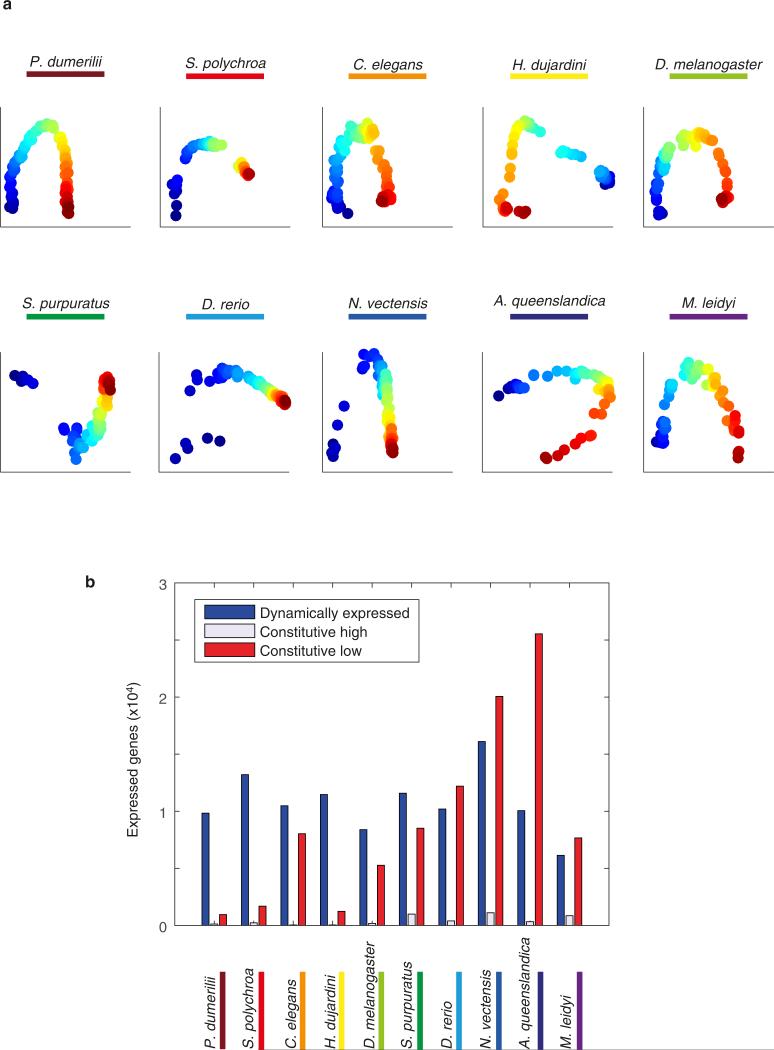
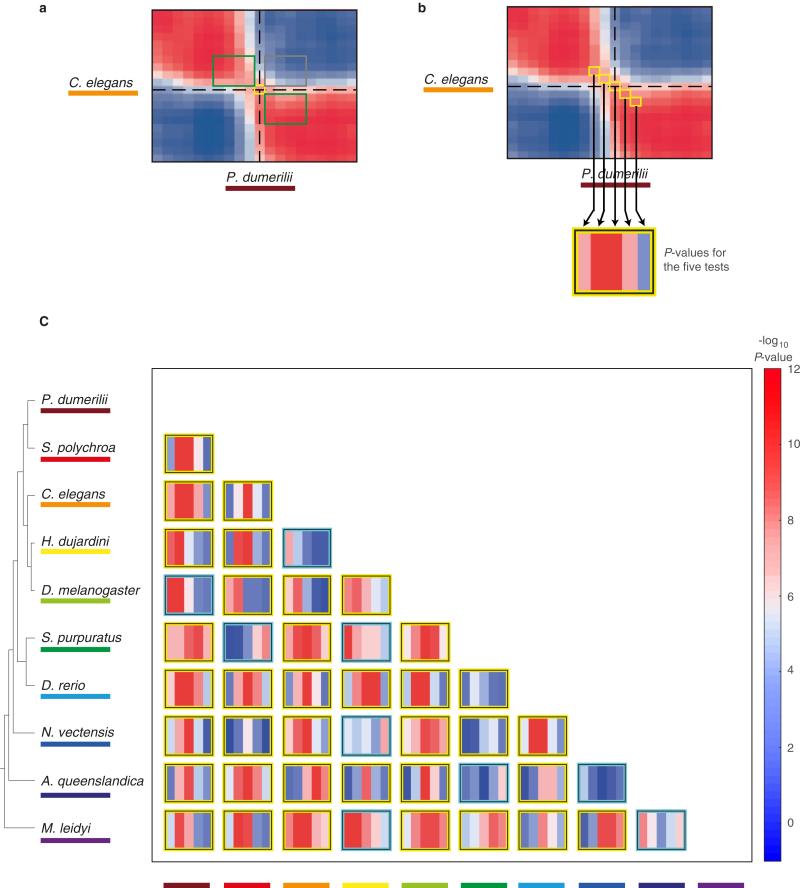
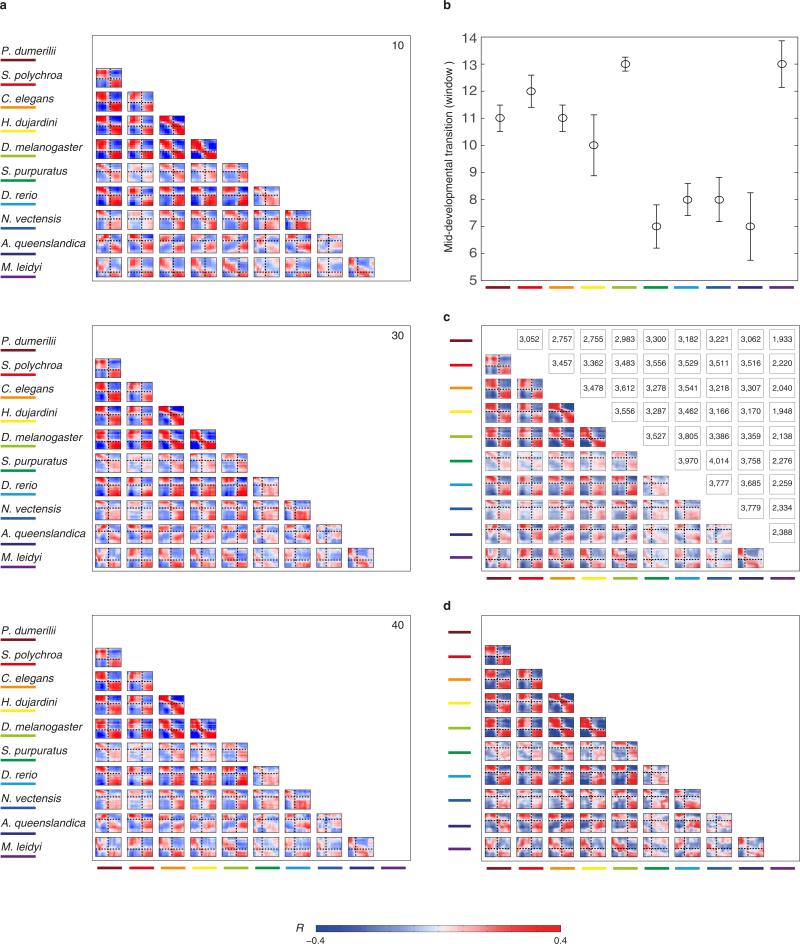
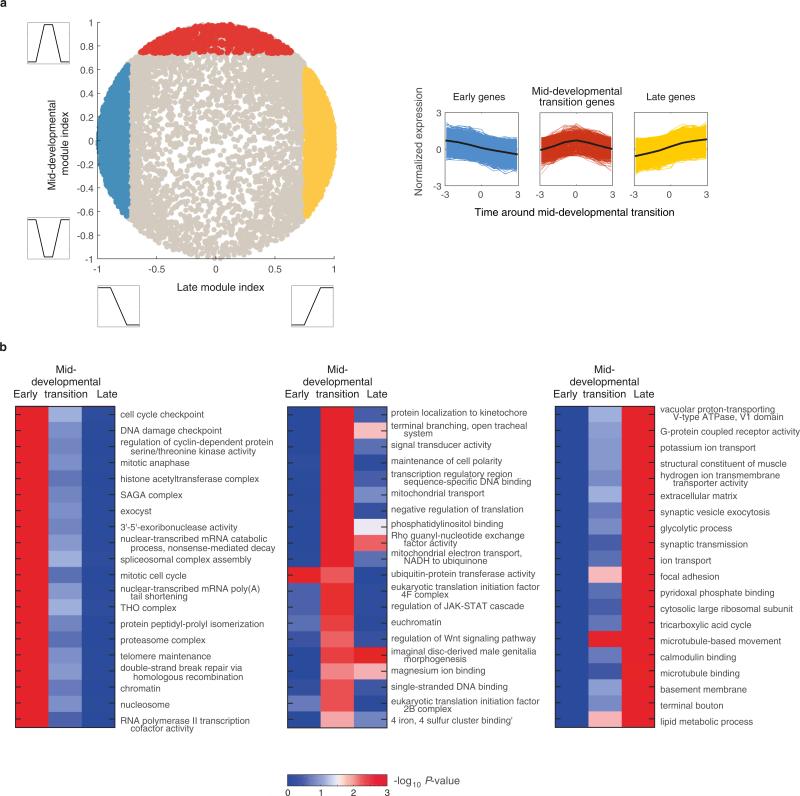
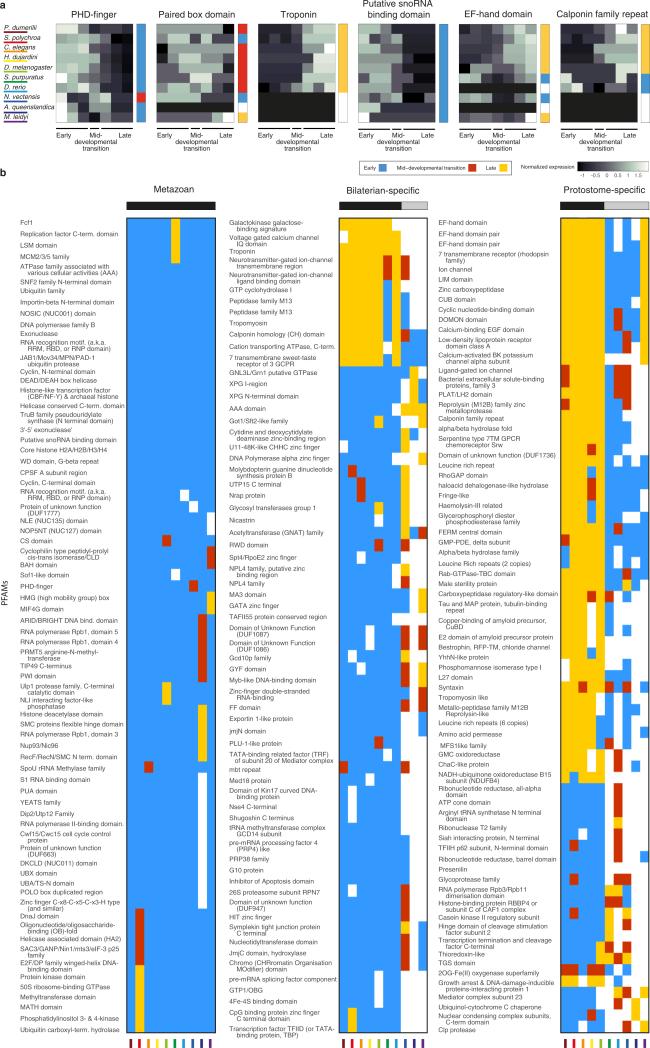
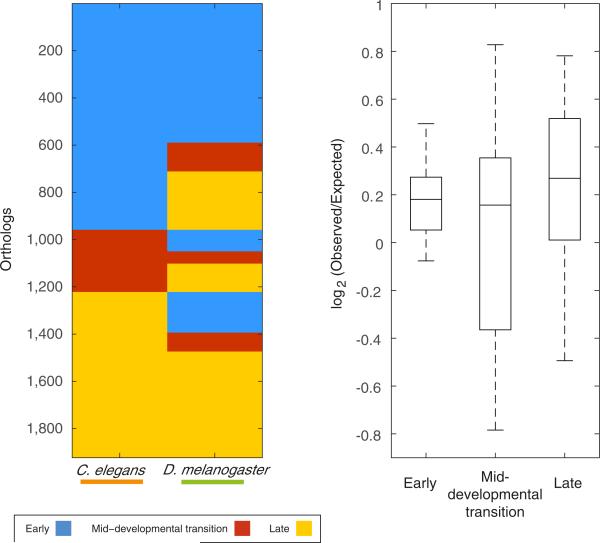
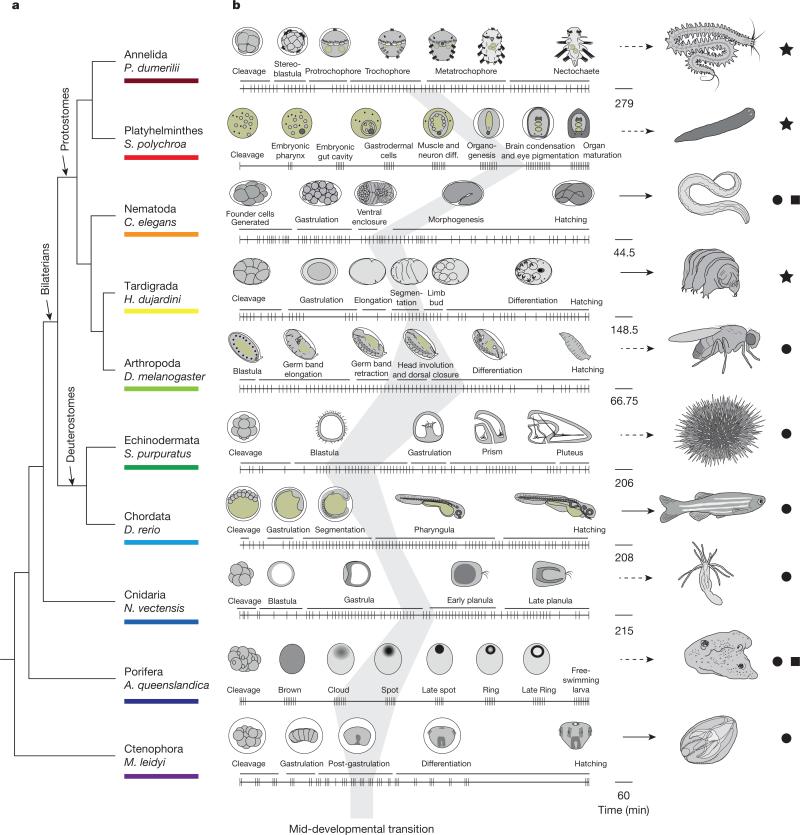
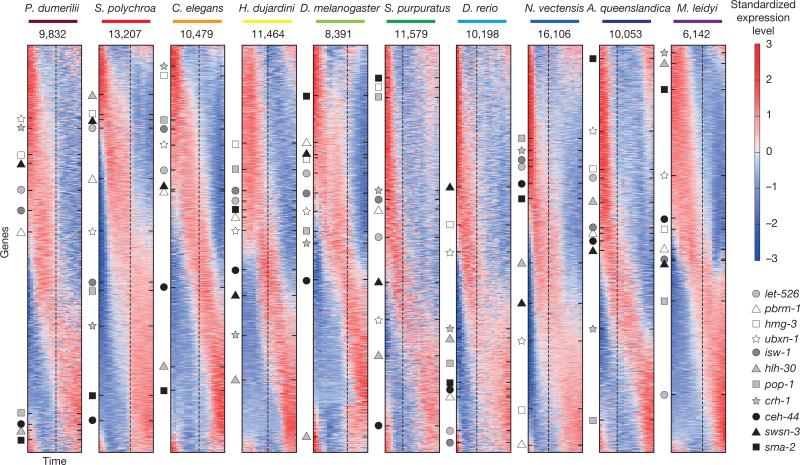
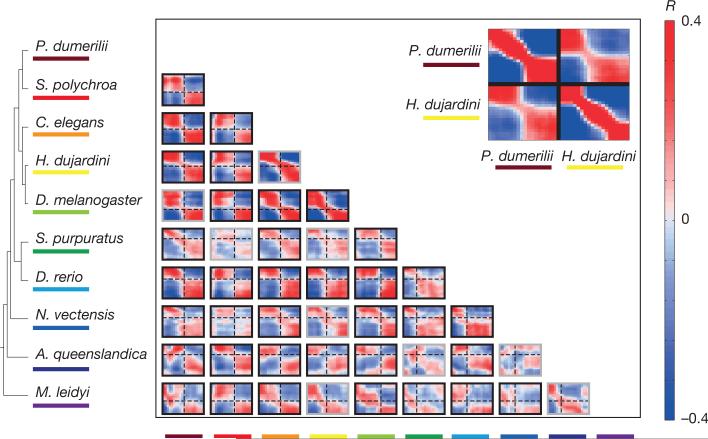
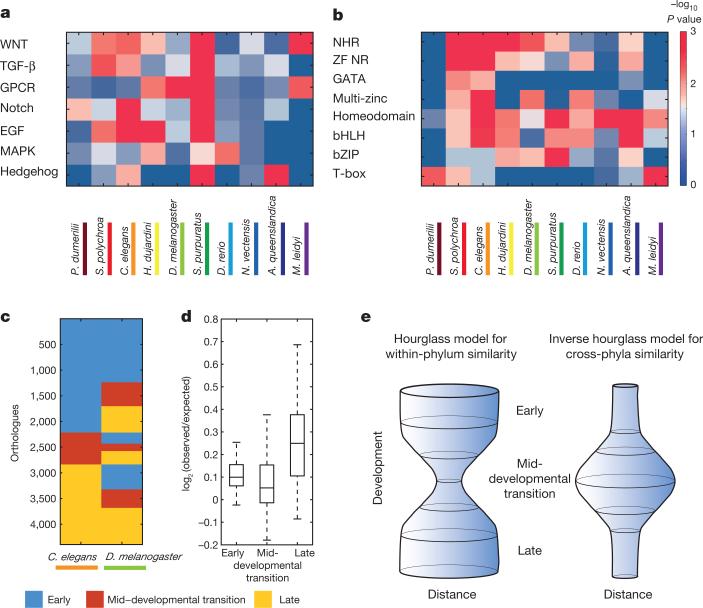
Animals are grouped into ~35 'phyla' based upon the notion of distinct body plans. Morphological and molecular analyses have revealed that a stage in the middle of development--known as the phylotypic period--is conserved among species within some phyla. Although these analyses provide evidence for their existence, phyla have also been criticized as lacking an objective definition, and consequently based on arbitrary groupings of animals. Here we compare the developmental transcriptomes of ten species, each annotated to a different phylum, with a wide range of life histories and embryonic forms. We find that in all ten species, development comprises the coupling of early and late phases of conserved gene expression. These phases are linked by a divergent 'mid-developmental transition' that uses species-specific suites of signalling pathways and transcription factors. This mid-developmental transition overlaps with the phylotypic period that has been defined previously for three of the ten phyla, suggesting that transcriptional circuits and signalling mechanisms active during this transition are crucial for defining the phyletic body plan and that the mid-developmental transition may be used to define phylotypic periods in other phyla. Placing these observations alongside the reported conservation of mid-development within phyla, we propose that a phylum may be defined as a collection of species whose gene expression at the mid-developmental transition is both highly conserved among them, yet divergent relative to other species.


Figures

Extended Data Figure 1
Extended Data Figure 1. A schematic for the de novo transcriptome analysis
See also the Methods section. CEL-Seq reads were mapped to the published transcriptomes where available.
Extended Data Figure 2
Extended Data Figure 2. Gene expression time-courses for ten species
a, BLIND analysis on the reported time-courses. The colour indicates the ordering. The species is indicated for each plot. b, The number of dynamically expressed genes for each species. The species are shown in the same order as in the main figures. Constitutively high (low) expression is defined as that where the maximum expression is more (less) than the 10 transcripts per million threshold yet is not dynamic (two-fold change and at least 10 transcripts per million maximum expression).
Extended Data Figure 3
Extended Data Figure 3. Testing the significance of the transition in the orthologue correlation matrices shown in Fig. 3
a, Schematic indicating the mid-developmental transition (orange), correlations among windows of the same phase (green), and correlations among windows of different phases (grey). b, The orange squares indicate statistical tests examined in c. c, For each pair of species a series of Kolmogorov–Smirnov tests are shown. Each test compares the intra-phase to the inter-phase correlations (a) for the mid-developmental transition and three windows before and after it (b). The yellow boxes indicate those species comparisons where there is significant statistical evidence for the dual-phase pattern (higher significance for the middle tests).
Extended Data Figure 4
Extended Data Figure 4. Robustness of Fig. 3 analysis
a, The analysis was repeated using the indicated number of sliding windows. b, The analysis was repeated by randomly removing embryo transcriptomes. From each of the ten data sets, we removed 10%, 20% or 30% of the embryos and repeated the analysis using 20 windows. We repeated this five times and then re-identified the mid-developmental transition. The plot indicates the median and standard deviation of the detected mid-developmental transition windows across these trials. In all species, the median is identical to the mid-developmental transition identified by the complete data set. c, d, Same as Fig. 3, using all detected orthologues for the pairwise comparisons (not limited to 1,500 as in Fig. 3, the number of examined orthologues are indicated above each plot) (c), and a set of 407 orthologues (d) across all taxa.
Extended Data Figure 5
Extended Data Figure 5. Gene enrichment analysis
a, A landscape showing for each gene (circle) the correlation with an idealized ‘late module profile’ (x axis) and with a ‘transition profile’ (y axis). The idealized profiles used to compute correlations are shown in the insets. Spots correspond to C. elegans genes. They are coloured according to the assigned sets: early module (blue), mid-developmental transition (red), and late module (yellow). b, Gene Ontology (GO) enrichment for the early phase, transition, and late phase gene sets. The gene sets were defined by integrating expression from all ten species. ‘RNA polymerase II...’ is short for ‘RNA polymerase II core promoter sequence-specific DNA binding transcription factor activity involved in preinitiation complex assembly’. The legend indicates the assigned sets: early phase (blue), mid-developmental transition (red), and late phases (yellow). The profiles are of length seven since we examined three windows before and after the mid-developmental transition.
Extended Data Figure 6
Extended Data Figure 6. PFAM enrichment and conservation across phyla
a, For each of 5,746 PFAM protein domains, we computed an expression signature based upon the fraction of its genes expressed at each stage throughout development across each of the ten species. As an example of this approach, a shows the signatures for six PFAMs, indicating the normalized fraction of genes in that group expressed at the time points surrounding the transition for each species. The profiles are centred according to the mid-developmental transition as defined in Fig. 3, examining four windows before and after it. The greyscale indicates the fraction of genes expressed in each window. We attributed a phase of expression for each PFAM in each species, as we have for individual genes. To the right of each PFAM signature is the annotated phase; early (blue), mid-developmental transition (red), or late (yellow). We then computed the degree to which the temporal expression across phyla matches a coherent phase expression in three groupings: metazoan, bilaterian, and protostomes. b, Metazoan (all ten species), bilaterian (all except the cnidarian, sponge, and ctenophore), and protostome (nematode, arthropod, tardigrade, annelid, and platyhelminth) groups are shown. To identify PFAMs in the metazoan group, we queried for PFAMs whose signature contains the same temporal phases of expression across the species. The metazoan-consistent PFAMs were nearly exclusively expressed in the early phase, suggesting stronger evolutionary constraints on this phase. A similar pattern was also observed for PFAMs with coherent expression in the seven bilaterian species in our data set. From this analysis, we conclude that bilaterians and protostomes each possess unique suites of innovations that are reflected in these shared phase-specific PFAM enrichments. Interestingly, protostome-coherent PFAMs are biased towards the late phases, possibly related to common differentiation processes operating in these taxa.
Extended Data Figure 7
Extended Data Figure 7. Same as Fig. 4c, d for PFAM analysis
The degree of conservation of early, transition, and late phase annotation of PFAMs was computed across species. A similar pattern was observed as that for orthologues (Fig. 4c, d).
Figure 1
Figure 1. Comparing development across ten phyla using CEL-Seq
a, A phylogeny of the examined species based on recent work,,. b, A representation of the times (notches) at which individual embryos were collected. Drawings of embryos at the indicated representative stages are shown above the collection time-course (on the right, timescale in minutes). The dark grey shading indicates the mid-developmental transitions. Stars, species where the developmental time-course is mapped to a mixed-stage transcriptome reported here; circles, mapped to the previously published genomes; squares, previously published time-courses,. Arrows indicate direct (solid) and indirect (dashed) developers.
Figure 2
Figure 2. Dynamic embryonic expression throughout the animal kingdom
Sorted standardized temporal gene expression profiles for each species. Genes of eleven orthologous groups are indicated by the markers along with the name of the C. elegans orthologue. The dashed lines indicate the timing of the mid-developmental transition. The number indicates expressed genes in each data set.
Figure 3
Figure 3. Cross-phyla comparison of developmental transcriptomes
Each heat map shows the correlations between the developmental transcriptomes of a pair of species based upon analysis of 1,500 highly expressed orthologues (similar results are observed for other sets of orthologues, Extended Data Fig. 4c, d). Dashed lines indicate the mid-developmental transitions. The grey box outlines indicate species-pairs in which the transition is not significant (Extended Data Fig. 3). The inset shows the comparison for H. dujardini and P. dumerill, showing also the self-correlations.
Figure 4
Figure 4. An inverse hourglass model for animal evolution
a, b, Functional enrichments for expression of seven signalling pathways (a) and seven transcription factor families (b) during the mid-developmental transitions. NHR, nuclear hormone receptors; ZF NR, zinc-finger nuclear receptors; multi-zinc, multiple zinc-fingers. c, Comparison of the orthologue temporal associations between C. elegans and D. melanogaster. d, Summary of the 45 pairwise species comparisons of orthologue temporal associations. e, Inverse hourglass model for the origin of phyla compared with the hourglass model for within-phylum evolution.

Comment in

References

    1. Valentine JW. On the Origin of Phyla. Univ. Chicago Press; 2004.
    1. Haeckel E. The Evolution of Man. Vol. 1. C. K. Paul & Company; 1879.
    1. Darwin C. Murray J, editor. On the Origin of Species by Means of Natural Selection, or, The Preservation of Favoured Races in the Struggle for Life. 1859 - PMC - PubMed
    1. Gould SJ. Ontogeny and Phylogeny. Harvard Univ. Press; 1977.
    1. Abzhanov A. Von Baer's law for the ages: lost and found principles of developmental evolution. Trends Genet. 2013;29:712–722. - PubMed

Publication types

Associated data