A Finite Element Model Approach to Determine the Influence of Electrode Design and Muscle Architecture on Myoelectric Signal Properties
- PMID: 26886908
- PMCID: PMC4757537
- DOI: 10.1371/journal.pone.0148275
A Finite Element Model Approach to Determine the Influence of Electrode Design and Muscle Architecture on Myoelectric Signal Properties
Abstract
Introduction: Surface electromyography (sEMG) is the measurement of the electrical activity of the skeletal muscle tissue detected at the skin's surface. Typically, a bipolar electrode configuration is used. Most muscles have pennate and/or curved fibres, meaning it is not always feasible to align the bipolar electrodes along the fibres direction. Hence, there is a need to explore how different electrode designs can affect sEMG measurements.
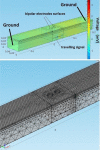
Method: A three layer finite element (skin, fat, muscle) muscle model was used to explore different electrode designs. The implemented model used as source signal an experimentally recorded intramuscular EMG taken from the biceps brachii muscle of one healthy male. A wavelet based intensity analysis of the simulated sEMG signal was performed to analyze the power of the signal in the time and frequency domain.
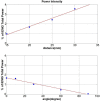
Results: The model showed muscle tissue causing a bandwidth reduction (to 20-92- Hz). The inter-electrode distance (IED) and the electrode orientation relative to the fibres affected the total power but not the frequency filtering response. The effect of significant misalignment between the electrodes and the fibres (60°-90°) could be reduced by increasing the IED (25-30 mm), which attenuates signal cancellation. When modelling pennated fibres, the muscle tissue started to act as a low pass filter. The effect of different IED seems to be enhanced in the pennated model, while the filtering response is changed considerably only when the electrodes are close to the signal termination within the model. For pennation angle greater than 20°, more than 50% of the source signal was attenuated, which can be compensated by increasing the IED to 25 mm.
Conclusion: Differences in tissue filtering properties, shown in our model, indicates that different electrode designs should be considered for muscle with different geometric properties (i.e. pennated muscles).
Conflict of interest statement
Figures


Similar articles
-
The effect of subcutaneous fat on myoelectric signal amplitude and cross-talk.Prosthet Orthot Int. 2003 Apr;27(1):48-54. doi: 10.3109/03093640309167976. Prosthet Orthot Int. 2003. PMID: 12812327
-
Comparison of surface EMG signals between electrode types, interelectrode distances and electrode orientations in isometric exercise of the erector spinae muscle.Electromyogr Clin Neurophysiol. 1997 Oct;37(7):439-47. Electromyogr Clin Neurophysiol. 1997. PMID: 9402434
-
Characterization of laplacian surface electromyographic signals during isometric contraction in biceps brachii.Annu Int Conf IEEE Eng Med Biol Soc. 2013;2013:535-8. doi: 10.1109/EMBC.2013.6609555. Annu Int Conf IEEE Eng Med Biol Soc. 2013. PMID: 24109742
-
Methodology of surface electromyography in gait analysis: review of the literature.J Med Eng Technol. 2019 Jan;43(1):59-65. doi: 10.1080/03091902.2019.1609610. Epub 2019 May 10. J Med Eng Technol. 2019. PMID: 31074312 Review.
-
Technology and instrumentation for detection and conditioning of the surface electromyographic signal: state of the art.Clin Biomech (Bristol). 2009 Feb;24(2):122-34. doi: 10.1016/j.clinbiomech.2008.08.006. Epub 2008 Nov 29. Clin Biomech (Bristol). 2009. PMID: 19042063 Review.
Cited by
-
The Role of Fascial Tissue Layer in Electric Signal Transmission from the Forearm Musculature to the Cutaneous Layer as a Possibility for Increased Signal Strength in Myoelectric Forearm Exoprosthesis Development.Bioengineering (Basel). 2023 Mar 2;10(3):319. doi: 10.3390/bioengineering10030319. Bioengineering (Basel). 2023. PMID: 36978710 Free PMC article.
-
Anatomically accurate model of EMG during index finger flexion and abduction derived from diffusion tensor imaging.PLoS Comput Biol. 2019 Aug 29;15(8):e1007267. doi: 10.1371/journal.pcbi.1007267. eCollection 2019 Aug. PLoS Comput Biol. 2019. PMID: 31465437 Free PMC article.
-
A Neuromotor to Acoustical Jaw-Tongue Projection Model With Application in Parkinson's Disease Hypokinetic Dysarthria.Front Hum Neurosci. 2021 Mar 15;15:622825. doi: 10.3389/fnhum.2021.622825. eCollection 2021. Front Hum Neurosci. 2021. PMID: 33790751 Free PMC article.
-
The science of bioelectrical impedance-derived phase angle: insights from body composition in youth.Rev Endocr Metab Disord. 2025 Aug;26(4):603-624. doi: 10.1007/s11154-025-09964-7. Epub 2025 Apr 10. Rev Endocr Metab Disord. 2025. PMID: 40208410 Free PMC article. Review.
-
Inkjet-printed fully customizable and low-cost electrodes matrix for gesture recognition.Sci Rep. 2021 Jul 22;11(1):14938. doi: 10.1038/s41598-021-94526-5. Sci Rep. 2021. PMID: 34294822 Free PMC article.
References
-
- Sherrington C. Ferrier Lecture: Some Functional Problems Attaching to Convergence. 1929;105(737):332–62.
-
- Basmajian JV, De Luca CJ, Deluca CJ . Muscles alive: their functions revealed by electromyography 5th / Basmajian John V., De Luca Carlo J.. ed. Baltimore; London: Williams & Wilkins; 1985. xii,561p. p.
-
- Nigg BM, Herzog W. Biomechanics of the musculo-skeletal system 3. ed. New Jersey: John Wiley & Sons; 2007. xiii, 672 s. p.
-
- Lieber RL, Fridén J. Functional and clinical significance of skeletal muscle architecture. Muscle Nerve. 2000;23(11):1647–66. - PubMed
Publication types
MeSH terms
LinkOut - more resources
Full Text Sources
Other Literature Sources

