. 2016 May 31;7(22):31862-77.
doi: 10.18632/oncotarget.7364.

Identification of novel long non-coding RNAs deregulated in hepatocellular carcinoma using RNA-sequencing

Affiliations

Identification of novel long non-coding RNAs deregulated in hepatocellular carcinoma using RNA-sequencing

Davide Degli Esposti et al. Oncotarget. .

Abstract

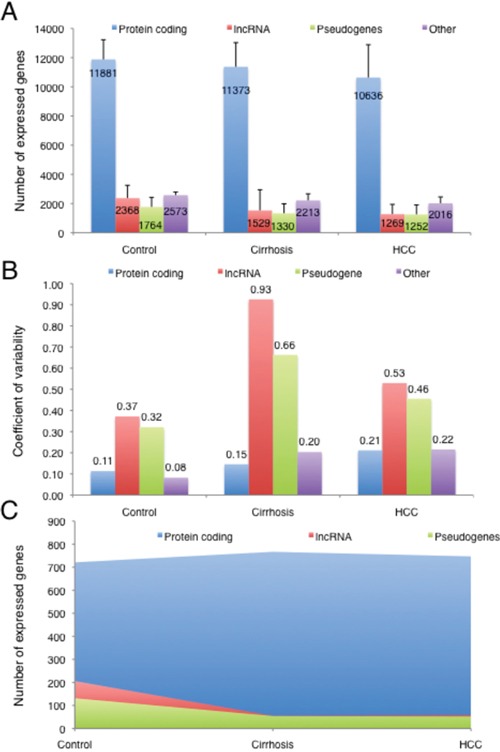
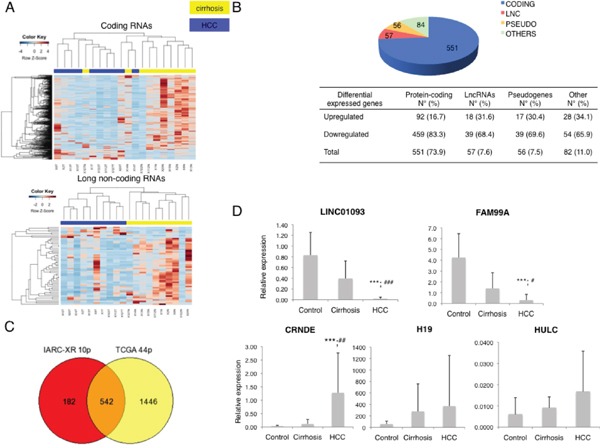
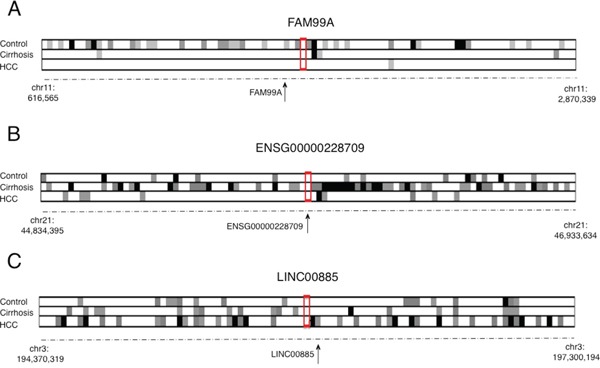
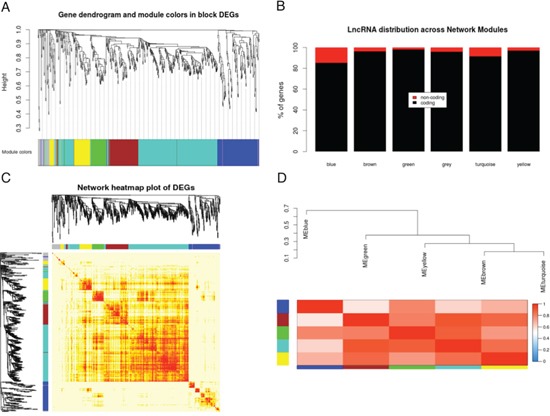
Functional characterization of long non-coding RNAs (lncRNAs) and their pathological relevance is still a challenging task. Abnormal expression of a few long non-coding RNAs have been found associated with hepatocellular carcinoma, with potential implications to both improve our understanding of molecular mechanism of liver carcinogenesis and to discover biomarkers for early diagnosis or therapy. However, the understanding of the global role of lncRNAs during HCC development is still in its infancy. In this study, we produced RNA-Seq data from 23 liver tissues (controls, cirrhotic and HCCs) and applied statistical and gene network analysis approaches to identify and characterize expressed lncRNAs. We detected 5,525 lncRNAs across different tissue types and identified 57 differentially expressed lncRNAs in HCC compared with adjacent non-tumour tissues using stringent criteria (FDR<0.05, Fold Change>2). Using weighted gene co-expression network analysis (WGCNA), we found that differentially expressed lncRNAs are co-expressed with genes involved in cell cycle regulation, TGF-β signalling and liver metabolism. Furthermore, we found that more than 20% of differentially expressed lncRNAs are associated to actively transcribed enhancers and that the co-expression patterns with their closest genes change dramatically during HCC development. Our study provides the most comprehensive compendium of lncRNAs expressed in HCC, as well as in control or cirrhotic livers. Our results identified both known oncogenic lncRNAs (such as H19 and CRNDE) and novel lncRNAs involved in cell cycle deregulation and liver metabolism deficits occurring during HCC development.

Keywords: RNA-sequencing; enhancer-associated RNAs; gene networks; hepatocellular carcinoma; long non-coding RNA.


Conflict of interest statement

The authors declare they have no competing financial interests.

Figures

Figure 1
Figure 1
A. Number of genes expressed in control livers (3 cases), cirrhotic livers adjacent to HCCs and HCCs (10 cases) for each different gene category. B. Expression variability of each gene category in control livers, cirrhotic livers adjacent to HCCs and HCCs. C. Uniquely expressed genes for each category in control livers, cirrhotic livers adjacent to HCCs and HCCs.
Figure 2
Figure 2
A. Heatmaps showing unsupervised clustering of HCC and adjacent cirrhotic tissues based on differentially expressed coding genes (up) and long non-coding genes (down). B. Distribution of differentially expressed genes by gene category. C. Overlap between differentially expressed genes in IARC-Croix Rousse cohort and TCGA paired matched cases, annotated with RefSeqGene. D. RT-qPCR results on 5 different lncRNAs in 20 cases (HCC and cirrhotic adjacent tissues) and 10 control livers.
Figure 3
Figure 3. Co-expression analysis of 3 different enhancer-associated lncRNA (eRNAs), representing the 3 main trends observed in the co-expression patterns of differentially expressed eRNAs
Each small square represents the P value for the correlation of the expression level in a specific gene pair. White, light gray, dark gray and black indicate Pearson's correlation P values of >0.05, <0.05, <0.01 and <0.001, respectively. A. Co-expression analysis for FAM99A. Loss of co-expression is observed in cirrhotic and HCC samples compared with control livers (χ2 test, p-value<0.05). B. Co-expression analysis for ENSG00000228709) Gain of co-expression in cirrhotic tissues compared with control livers or HCCs (χ2 test, p-value<0.05). C. Co-expression analysis for LINC00885. Gain of co-expression is observed in HCC compared with cirrhotic or control livers (χ2 test, p-value<0.05).
Figure 4
Figure 4. Gene co-expression network analysis of differentially expressed genes
A. Gene clustering and module identification. Each co-expression cluster has a different colour. B. LncRNAs distribution in the different modules. C. Co-expression matrix showing relations across the different modules. D. Eigengene heatmap showing correlation among the different eigengene vectors of each module.

References

    1. Ferlay J, Soerjomataram I, Ervik M, Dikshit R, Eser S, Mathers C, Rebelo M, Parkin DM, Forman D, Bray F. GLOBOCAN 2012 v1.0. Cancer Incidence and Mortality Worldwide: IARC CancerBase No. 11. 2015 http://globocan.iarc.fr - PubMed
    1. Theise ND. Liver Cancer. In: Stewart Bernard W, Wild Christopher P., editors. World Cancer Report 2014. IARC Press; Lyon: 2014.
    1. McGlynn KA, London WT. The Global Epidemiology of Hepatocellular Carcinoma: Present and Future. Clinics in Liver Disease. 2011;15:223–43. - PMC - PubMed
    1. McGlynn KA, Petrick JL, London WT. Global Epidemiology of Hepatocellular Carcinoma. Clinics in Liver Disease. 2015;19:223–38. - PMC - PubMed
    1. Welzel TM, Graubard BI, Quraishi S, Zeuzem S, Davila JA, El-Serag HB, McGlynn KA. Population-Attributable Fractions of Risk Factors for Hepatocellular Carcinoma in the United States. The American Journal of Gastroenterology. 2013;108:1314–21. - PMC - PubMed

MeSH terms