. 2016 Feb 17:17:88.
doi: 10.1186/s12859-016-0927-7.

CellECT: cell evolution capturing tool

Affiliations

CellECT: cell evolution capturing tool

Diana L Delibaltov et al. BMC Bioinformatics. .

Abstract

Background: Robust methods for the segmentation and analysis of cells in 3D time sequences (3D+t) are critical for quantitative cell biology. While many automated methods for segmentation perform very well, few generalize reliably to diverse datasets. Such automated methods could significantly benefit from at least minimal user guidance. Identification and correction of segmentation errors in time-series data is of prime importance for proper validation of the subsequent analysis. The primary contribution of this work is a novel method for interactive segmentation and analysis of microscopy data, which learns from and guides user interactions to improve overall segmentation.

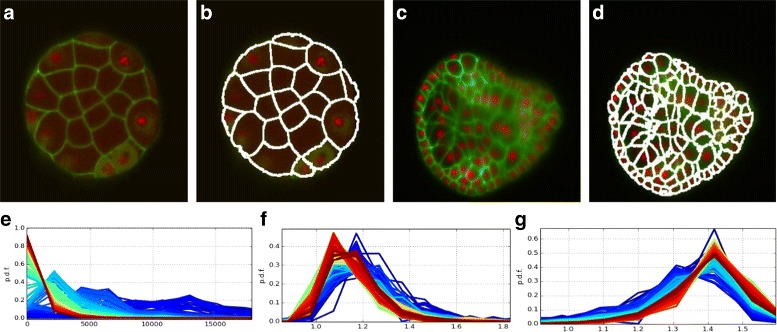
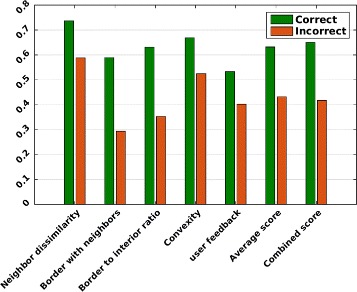
Results: We introduce an interactive cell analysis application, called CellECT, for 3D+t microscopy datasets. The core segmentation tool is watershed-based and allows the user to add, remove or modify existing segments by means of manipulating guidance markers. A confidence metric learns from the user interaction and highlights regions of uncertainty in the segmentation for the user's attention. User corrected segmentations are then propagated to neighboring time points. The analysis tool computes local and global statistics for various cell measurements over the time sequence. Detailed results on two large datasets containing membrane and nuclei data are presented: a 3D+t confocal microscopy dataset of the ascidian Phallusia mammillata consisting of 18 time points, and a 3D+t single plane illumination microscopy (SPIM) dataset consisting of 192 time points. Additionally, CellECT was used to segment a large population of jigsaw-puzzle shaped epidermal cells from Arabidopsis thaliana leaves. The cell coordinates obtained using CellECT are compared to those of manually segmented cells.

Conclusions: CellECT provides tools for convenient segmentation and analysis of 3D+t membrane datasets by incorporating human interaction into automated algorithms. Users can modify segmentation results through the help of guidance markers, and an adaptive confidence metric highlights problematic regions. Segmentations can be propagated to multiple time points, and once a segmentation is available for a time sequence cells can be analyzed to observe trends. The segmentation and analysis tools presented here generalize well to membrane or cell wall volumetric time series datasets.


Figures

Fig. 1
Fig. 1
Image segmentation challenges. a Reconstructed cross-section of a SPIM light sheet microscopy volume of the ascidian P. mammillata showing an artifact in which as many as five nuclei appear connected. This makes it difficult for existing nuclei detection methods to properly segment. b Weak signal in the membrane channel in lower z slices of a confocal microscopy image. c Inconsistent signal strength in the cell wall channel of a z slice through a confocal microscopy image of Arabidopsis thaliana (image courtesy Elliot Meyerowitz Lab, Division of Biology, California Institute of Technology). d Cells with interrupted membrane which share cytoplasm, as in this example of the Caenorhabditis elegans gonad cells [32]. Watershed segmentation methods will have difficulty segmenting such structures due to leakage. e Sperm cells appear in the nuclei channel resulting in false positives for a nuclei detector [32]. f Dividing P. mammillata cell SPIM images that show up as large nuclei
Fig. 2
Fig. 2
CellECT software screenshots. CellECT enables the interactive segmentation and analysis of 3D+t microscopy membrane (or cell wall) volumes. Screenshots of CellECT’s main interface (left-most), the interactive segmentation tool (left-middle), and analysis module (right) are shown above
Fig. 3
Fig. 3
User markers. a Seeds (in black), and the shortest path through the geodesic image space between identically-labelled seeds. These seeds and paths are given as initialization points or strokes to a seeded Watershed algorithm. b An xy and an xz plane through the resulting segmentation. c the corresponding planes through the original image
Fig. 4
Fig. 4
Example of problematic segments. A correct segment exhibits one or more of these characteristics: the boundary signal intensity as stronger than the interior, the common boundary with a neighboring cell has high intensity, the segment shape is almost convex and the segment’s shape is similar to that of its neighbors. Incorrect segments indicated by arrows: a segment is far from convex, b signal intensity in the membrane channel is not high on the segment border, c signal intensity in the membrane channel is too high in the segment interior, de segments are not similar to their surroundings
Fig. 5
Fig. 5
a Segments represented as nodes in a graph. Edges connect neighboring segment. Two segments (p 1 and p 2) marked by the user as correct. b Disseminate credit from the correct segments to other segments in the graph, based on similarity within the neighborhood. c Confidence credit disseminated from segment p 1 to all other segments along the path of highest similarity. d Credit disseminated from p 2
Fig. 6
Fig. 6
Cellness metric example. a Slice through the original confocal microscopy image. b Propagation of confidence from segments marked as correct (indicated by arrows) to similar neighbors. c Color coded cellness metric. d Reconstructed cross section in the xz plane of the cell with low cellness metric indicated by arrow in panel. This segment appears correct in the view from panel C however it has a low cellness score. e Error in the segmentation, indicated by arrow, observable in the cross section (the segment leaks into the cell below). The cellness metric helped identify this error in segmentation
Fig. 7
Fig. 7
Ascidian-18 dataset: ad original slice and respective segmentation for t=0 (stage 15) and t=17 (stage 21) (E) Clustering of cells with similar properties identifies tissues f – g Nuclei at t=0 and t=17 in each of the four regions of interest: notochord (yellow), muscle (blue), endoderm and neural tube (red), epidermis (green). hi Average cell measurments over time per region of interest: h volume i flatness
Fig. 8
Fig. 8
Ascidian-192 dataset: ad original slice and respective segmentation for t=0 (stage 6) and t=192 (stage 19) eg: Superimposed histograms of segment measurments, color coded by time point (from blue to red): e volume, b sphericity, c entropy
Fig. 9
Fig. 9
A. thaliana pavement cells: Left column: Original slices, Middle: Segmentations overlaid on original slices, Right: Segmentation label maps
Fig. 10
Fig. 10
Quantitative evaluation of the segmentation: a F-measure for the segmentation of fifty randomly selected cells from the last five time points of the Ascidian-192 dataset. Four segmentation results are compared: (1) nuclei detector initialization, (2) propagation of corrected volumes, (3) chain propagation without corrections, (4) propagated and corrected volumes. b F-measure for four approaches to the segmentation of time points 188–192 from the Ascidian-192 dataset
Fig. 11
Fig. 11
Cellness metric for correct and incorrect cells. Cellness metric in sorted order for hand picked cells in two categories, “Correct” and “Incorrect”, over five time points (t=0,4,8,12,17) of the Ascidian-18 dataset. The two classes of cells separate well for the different time points
Fig. 12
Fig. 12
Cellness metric components. Score of each cellness metric component over ten “Correct” and ten “Incorrect” cells from t=17 of the Ascidian-18 dataset, and the combined cellness score
Fig. 13
Fig. 13
Average cellness metric components. Average scores over the ten cells in each class for each cellness metric component, the average of all components, and the combined score (cellness). “Correct” cells obtain a higher cellness score than “Incorrect” cells

References

    1. Derde M, Antanas L, De Raedt L, Guiza Grandas F. An interactive learning approach to histology image segmentation. In: Proceedings of the 24th Benelux Conference on Artificial Intelligence: 2012. p. 1–8.
    1. Sommer C, Straehle C, Kothe U, Hamprecht FA. Ilastik: Interactive learning and segmentation toolkit. In: Biomedical Imaging: From Nano to Macro, 2011 IEEE International Symposium On. IEEE: 2011. p. 230–233.
    1. McGuinness K, O’Connor NE. A comparative evaluation of interactive segmentation algorithms. Pattern Recognit. 2010;43(2):434–44. doi: 10.1016/j.patcog.2009.03.008. - DOI
    1. Du CJ, Marcello M, Spiller DG, White MR, Bretschneider T. Interactive segmentation of clustered cells via geodesic commute distance and constrained density weighted nyström method. Cytometry Part A. 2010;77(12):1137–47. doi: 10.1002/cyto.a.20993. - DOI - PubMed
    1. Lin G, Chawla MK, Olson K, Barnes CA, Guzowski JF, Bjornsson C, et al. A multi-model approach to simultaneous segmentation and classification of heterogeneous populations of cell nuclei in 3d confocal microscope images. Cytometry Part A. 2007;71(9):724–36. doi: 10.1002/cyto.a.20430. - DOI - PubMed

Publication types