. 2016 Feb 18;530(7590):358-61.
doi: 10.1038/nature16955.

Cryo-EM reveals a novel octameric integrase structure for betaretroviral intasome function

Affiliations

Cryo-EM reveals a novel octameric integrase structure for betaretroviral intasome function

Allison Ballandras-Colas et al. Nature. .

Abstract

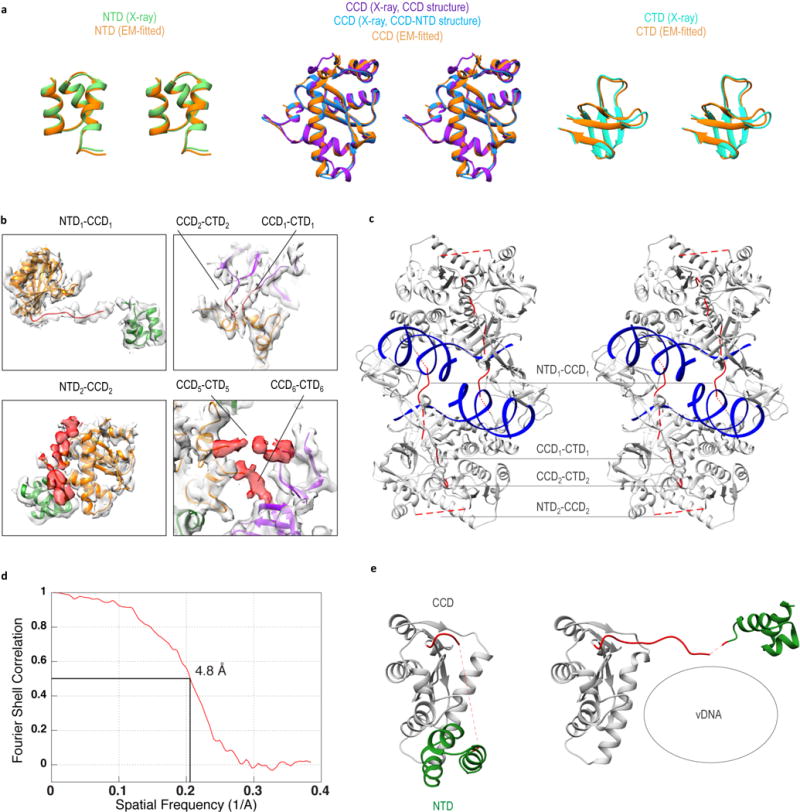
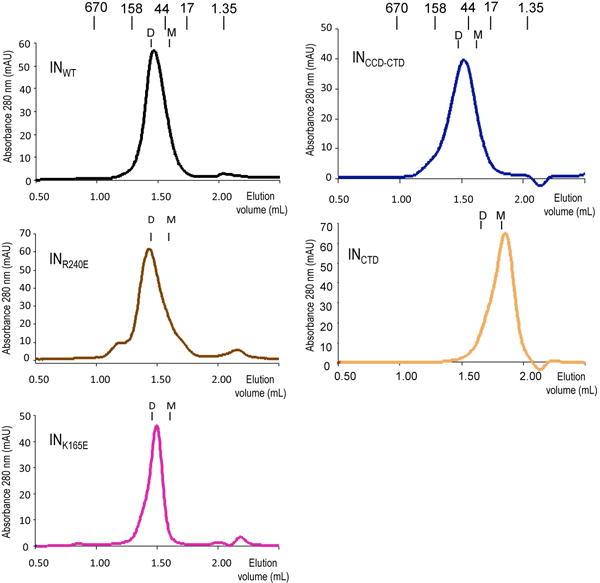
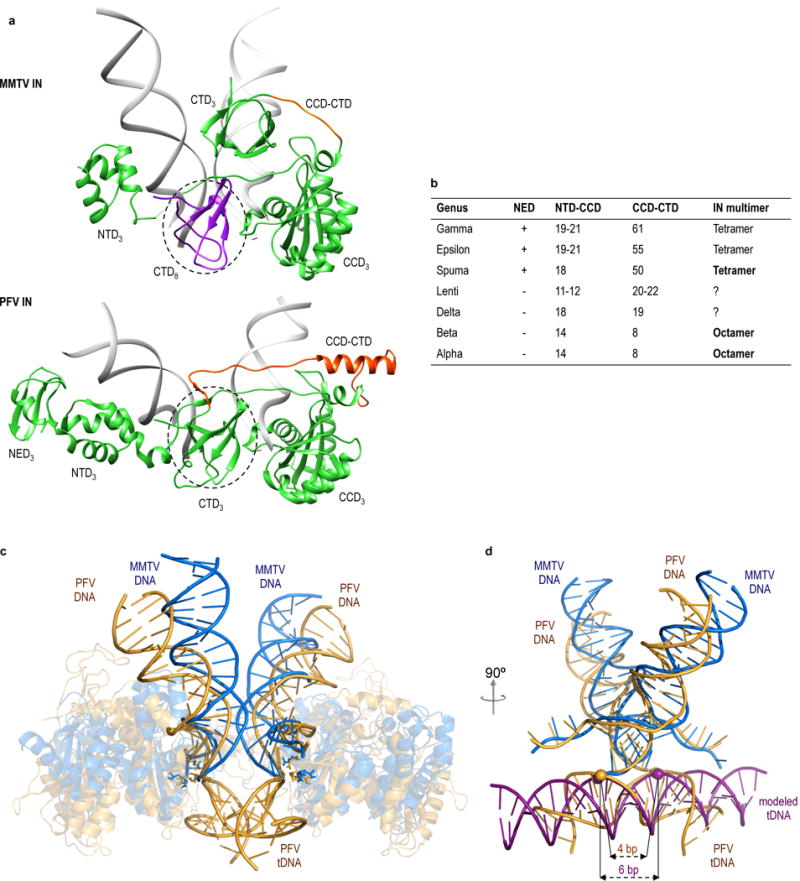
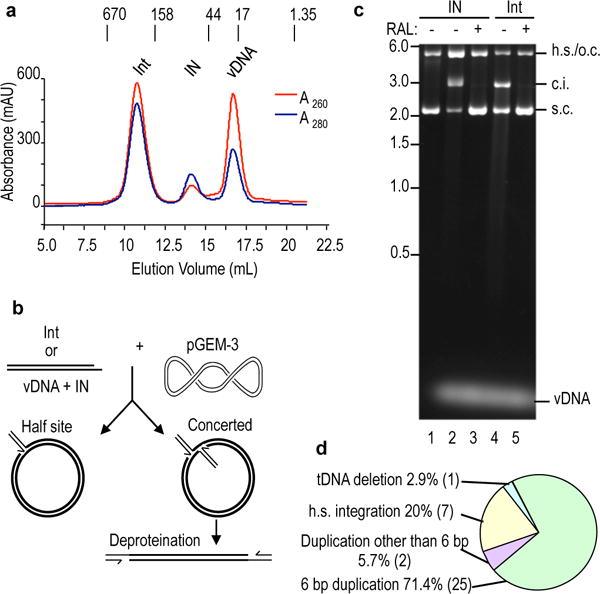
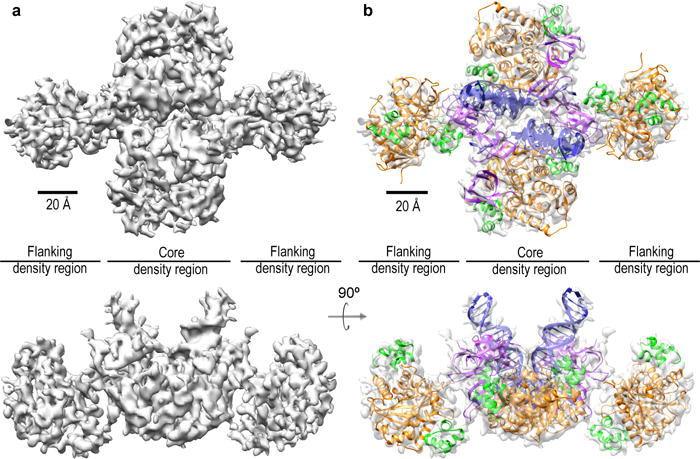
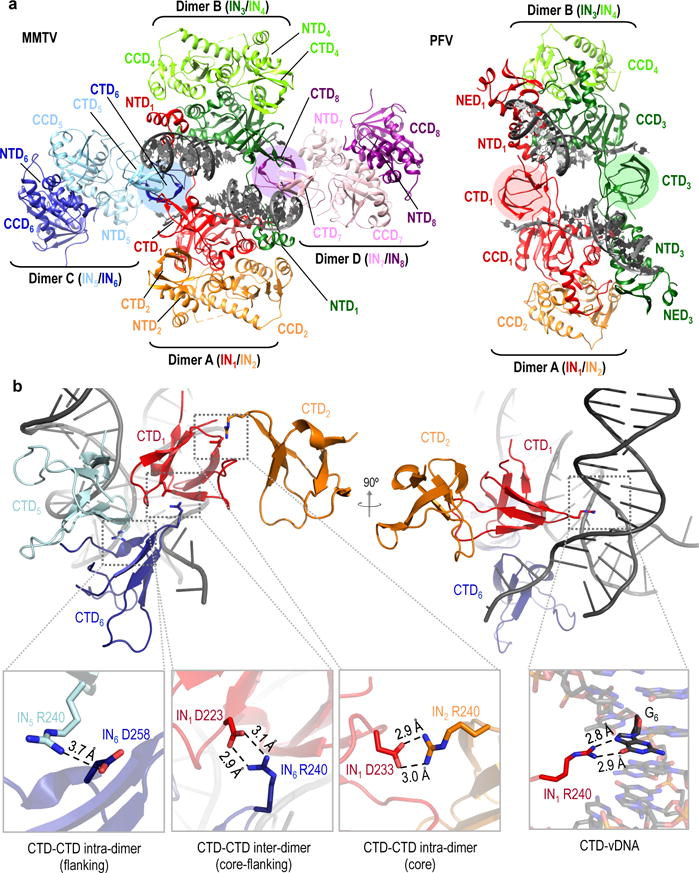
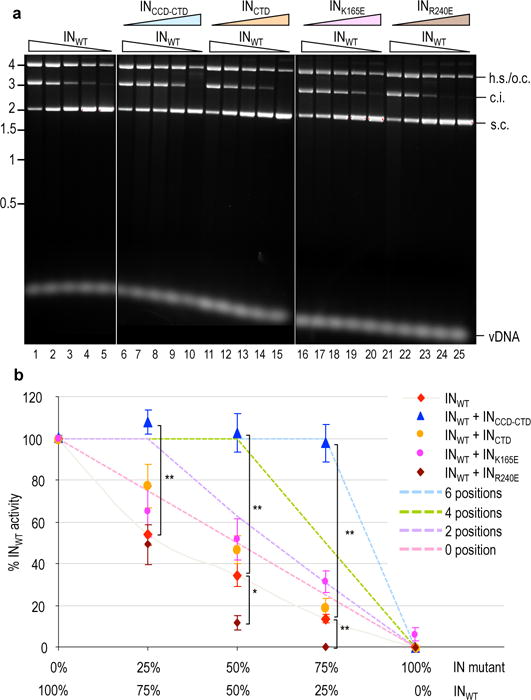
Retroviral integrase catalyses the integration of viral DNA into host target DNA, which is an essential step in the life cycle of all retroviruses. Previous structural characterization of integrase-viral DNA complexes, or intasomes, from the spumavirus prototype foamy virus revealed a functional integrase tetramer, and it is generally believed that intasomes derived from other retroviral genera use tetrameric integrase. However, the intasomes of orthoretroviruses, which include all known pathogenic species, have not been characterized structurally. Here, using single-particle cryo-electron microscopy and X-ray crystallography, we determine an unexpected octameric integrase architecture for the intasome of the betaretrovirus mouse mammary tumour virus. The structure is composed of two core integrase dimers, which interact with the viral DNA ends and structurally mimic the integrase tetramer of prototype foamy virus, and two flanking integrase dimers that engage the core structure via their integrase carboxy-terminal domains. Contrary to the belief that tetrameric integrase components are sufficient to catalyse integration, the flanking integrase dimers were necessary for mouse mammary tumour virus integrase activity. The integrase octamer solves a conundrum for betaretroviruses as well as alpharetroviruses by providing critical carboxy-terminal domains to the intasome core that cannot be provided in cis because of evolutionarily restrictive catalytic core domain-carboxy-terminal domain linker regions. The octameric architecture of the intasome of mouse mammary tumour virus provides new insight into the structural basis of retroviral DNA integration.


Conflict of interest statement

The authors declare no competing financial interests.

Figures

Extended Data Figure 1
Extended Data Figure 1. Cryo-EM data and refinement
a, Representative cryo-electron micrograph of MMTV intasomes, taken at 2.7 μm underfocus. b, Same as in panel a, marked to show selected particles. c, 2D class averages calculated using Relion. d, Initial model from the class averages calculated using OptiMod. e, Refined reconstruction from the full dataset, with an Euler angle distribution plot showing the relative orientations of the particles.
Extended Data Figure 2
Extended Data Figure 2. Cryo-EM resolution analysis of reconstructed intasome maps
a, Fourier shell correlation (FSC) curve corresponding to the refined map generated from the full intasome dataset. b, FSC curve corresponding to the refined map generated from the core intasome dataset with the NTDs, CCDs and interdomain linker regions of the flanking IN dimers computationally subtracted. Average global resolutions in panels a and b are indicated. c, Refined map generated from the full dataset (left) displayed side-by-side with the same map colored for local resolution (right). d, Refined map generated from the core intasome dataset (left) displayed side-by-side with the same map colored for local resolution (right) using the coloring scheme in panel c. e, Rotational snapshots of segmented density of CCD1 with the fit of the refined model (see Extended Data Fig. 6) highlighting structural features evident at ~4–5 Å resolution. Partial separation of β-strands, which is typically evident at or beyond 4.5 Å resolution, is apparent.
Extended Data Figure 3
Extended Data Figure 3. Structural heterogeneity of the MMTV intasome
a, Stable structural conformation of the MMTV intasome after 3D classification of the data. Slices from the density map are displayed below. b, One of several conformations of MMTV intasome refinement after 3D classification of the data. Slices from the density map are displayed below. Multiple fuzzy regions in the flanking INs are apparent in b, which are indicative of remaining heterogeneity within the data and/or continuous structural mobility of the region. c, Overlay of the two reconstructed maps, highlighting the extent of mobility within the flanking regions (brackets).
Extended Data Figure 4
Extended Data Figure 4. MMTV IN domains and intasome sedimentation coefficient distribution
a, Primary IN sequence alignment with boxes denoting canonical IN structural domains. The N-terminal extension domain (NED) occurs in spuma-, γ- and ɛ-retroviral IN proteins. Identical residues between MMTV, RSV, HIV-1 and PFV INs are highlighted by red background; residues that are minimally conserved in three of the sequences are in red. PFV IN secondary structure elements are from PDB code 3L2Q; MMTV elements are from the INNTD-CCD and INCTD crystal structures described here (PDB codes 5CZ2 and 5D7U, respectively). α, β, η, TT and TTT represent α helix, β strand, 310 helix, α-turn and β-turn, respectively. Figure generated with ESPript 3.0 (ref. 61). b, Monte Carlo analysis of sedimentation velocity data for the higher loading concentrations of vDNA (green), MMTV IN (blue) and intasome (red). A clear shift to a discrete species at 10.5 s is observed for the intasome, with minor IN and vDNA populations evident. Different centrifugation parameters for IN and vDNA versus intasomes (see Methods) likely attributed to the minor variations in sedimentation coefficient between major and minor IN and vDNA species. Measured sedimentation coefficients and calculated molar masses compared to theoretical molar masses are shown beneath the graph.
Extended Data Figure 5
Extended Data Figure 5. MMTV IN domain crystal structures
a, Stereo view of the final 2Fo-Fc density map of the INCCD crystal structure with blue mesh contoured at 1σ. Amino acid side chains are readily evident at the 1.7 Å resolution. b, Stereo view of the final 2Fo-Fc density map of the 2.7 Å resolution INNTD-CCD crystal structure with blue mesh contoured at 1σ. The map is centered on the DDE catalytic triad (red sticks); green spheres, Mg2+ ions. c, Cartoon representation of the INCCD monomer (one of 4 in the crystallographic asymmetric unit) colored in gold. Active site residues are shown as red sticks. d, Cartoon representation of the INNTD-CCD dimer structure (one of 3 in the asymmetric unit). The NTD and CCD are colored green and gold, respectively. Red sticks, active site residues; grey and green spheres, Zn2+ and Mg2+ ions, respectively. e, Stereo view of the final 2Fo-Fc density map of the 1.5 Å resolution INCTD crystal structure, shown as a green mesh contoured at 1σ. f, Cartoon representation of one of the two CTD monomers present in the asymmetric unit.
Extended Data Figure 6
Extended Data Figure 6. Molecular modeling of cryo-EM density
a, Stereo views showing comparisons between the starting X-ray domain models and refined cryo-EM domain models for IN1 highlight relatively minor structural perturbations that are evident only in the most flexible regions of the intasome. b, Linker region snapshots. Atomic models were built de novo from the cryo-EM density for the indicated linkers in the top two panels (residues 45–54 connecting NTD1 and CCD1 and CCD-CTD residues 211–213). Linkers NTD2-CCD2, CCD5-CTD5 and CCD6-CTD6 were not modeled, but are shown as cryo-EM density (red) in the lower panels. c, Stereo view of the cryo-EM model for the MMTV intasome core region (Extended Data Fig. 2d), generated using Rosetta. All domains were refined starting with the X-ray crystal structures (Extended Data Fig. 5). Specific linker regions were built de novo (continuous red lines) from the cryo-EM density, whereas lower resolution linker regions (red dotted lines) were omitted from the model. d, FSC curve between the refined cryo-EM core intasome model and map, showing an average resolution of 4.8 Å. e, Comparison of two NTD-CCD conformations in the intasome highlights the NTD-CCD linker, which assumes a retracted state in the outer IN2 and IN4 monomers of core intasome dimers A and B, respectively, as well as in flanking IN dimers C and D (left). The linker extends in core IN molecules IN1 and IN3, which interact with the vDNA (right).
Extended Data Figure 7
Extended Data Figure 7. Gel filtration profiles of INWT and IN mutant proteins
Migration positions of mass standards in kDa as well as theoretical protein monomer (M) and dimer (D) positions are indicated.
Extended Data Figure 8
Extended Data Figure 8. Comparisons of PFV and MMTV intasome structures
a, Cartoon representations of the inner IN3 green subunits of the MMTV and PFV intasomes (Fig. 3a; vDNA strands are in grey). CCD-CTD linker regions are highlighted in orange, and dashed lines circle analogously positioned CTDs. Of note, this CTD in the MMTV structure is colored differently because it originates from a separate IN molecule (IN8 from flanking dimer D). b, Lengths of NTD-CCD and CCD-CTD interdomain linker regions across retroviral IN proteins; ‘+’ indicates the presence of an NED. The multimeric state of IN in known intasome structures is indicated by bold type. c, The PFV intasome with bound tDNA (PDB code 3OS2; orange) was superimposed with the MMTV intasome (blue). The distance between overlaid active sites is in each case ~26 Å. d, 90° rotation of superimposed structures, with proteins omitted for clarity. Canonical B-form tDNA (magenta) was superimposed with PFV intasome tDNA. The positions of phosphodiester bonds staggered by 4 bp in the PFV crystal structure or by 6 bp in the modeled tDNA are indicated by spheres.
Figure 1
Figure 1. MMTV intasome (Int) characterization
a, Purification by SEC. Elution positions of mass standards in kDa are indicated. b, Integration assay schematic. Int or IN plus vDNA was reacted with supercoiled tDNA, which can yield half site (h.s.) or concerted integration (c.i.) products. c, Ethidium bromide-stained agarose gel. Lane 1–3 reactions were initiated with IN; vDNA was omitted from lane 1. Raltegravir (RAL) was included as indicated. Lanes 4 and 5, Int reactions. Migrations positions of h.s. products that co-migrate with open circular (o.c.) tDNA, c.i. products, supercoiled (s.c.) tDNA and mass standards in kb are indicated. For gel source data, see Supplementary Figure 1. d, Sequenced Int-mediated concerted integration products (n=35).
Figure 2
Figure 2. Cryo-EM structure of the MMTV intasome
a, top view (upper) of the cryo-EM map; the lower view is rotated 90°. Core density and flanking density regions are indicated. b, Individual domain crystal structures (NTD, green; CCD, orange; CTD, purple) and vDNA (blue) model fitted by rigid body docking. Rulers demarcate 20 Å.
Figure 3
Figure 3. Comparison of MMTV and PFV intasome structures
a, MMTV (left) and PFV (right) intasomes color coded to highlight IN dimers and constituent protomers. Core dimers A and B are red-orange and green-chartreuse, respectively, while MMTV flanking IN dimers C and D are blue-sky blue and purple-light pink, respectively. Colored circles highlight similarly positioned CTDs between structures. b, Close-up views of Arg240-mediated protein (left) and vDNA (right; G6 of plus-strand) interactions. For simplicity, only one set of asymmetric interactions is shown. The interaction of IN5 with residues 258–261 of IN6 varied during model refinement, with the indicated interaction (as well as other atomic distances) observed in the final refined model. Colors are conserved between panels a and b.
Figure 4
Figure 4. MMTV intasome functionality
a, Representative agarose gels. The reactions in lanes 1–4 contained 1,0, 0.75, 0.5, 0.25 μM INWT, respectively; IN was omitted from the reaction in lane 5. Subsequent 5-reaction sets contained the same INWT concentrations with 0, 0.25, 0.5, 0.75, 1.0 μM of the indicated mutant protein, for a total concentration of 1 μM IN in lanes 6–25. Lanes 1–5 versus lanes 6–15 and 16–25 were from separate agarose gels (see Supplementary Fig. 1 for gel source data); other labeling as in Fig. 1. b, Dashed lines indicate theoretical activities (graphed as percent INWT activity) for mixtures that contain a mutant protein that supports full INWT function when present in 6 of 8 octamer positions (blue dashed line), 4 of 8 positions (green dashes), 2 positions (purple dashes) or is unable to complement INWT function (pink dashes). Actual activities are from 4 technical replicates (average ± s.e.m.; see Supplementary Table 1 for source data). The non-linear response of INWT (grey line with red diamonds) likely reflects concentration-dependent cooperative multimerization of IN with vDNA. The INWT alone and INWT + INCTD values were not significantly different (P >0.1; two-tailed t-test). *, P <0.05; **, P <0.01.

References

    1. Craigie R, Bushman FD. HIV DNA integration. Cold Spring Harb Perspect Med. 2012;2:a006890. - PMC - PubMed
    1. Hare S, Gupta SS, Valkov E, Engelman A, Cherepanov P. Retroviral intasome assembly and inhibition of DNA strand transfer. Nature. 2010;464:232–236. - PMC - PubMed
    1. Maertens GN, Hare S, Cherepanov P. The mechanism of retroviral integration from X-ray structures of its key intermediates. Nature. 2010;468:326–329. - PMC - PubMed
    1. Hare S, Maertens GN, Cherepanov P. 3′-processing and strand transfer catalysed by retroviral integrase in crystallo. EMBO J. 2012;31:3020–3028. - PMC - PubMed
    1. Maskell DP, et al. Structural basis for retroviral integration into nucleosomes. Nature. 2015;523:366–369. - PMC - PubMed

Publication types

MeSH terms