

The consistent difference in red fluorescence in fishes across a 15 m depth gradient is triggered by ambient brightness, not by ambient spectrum
- PMID: 26887560
- PMCID: PMC4756498
- DOI: 10.1186/s13104-016-1911-z
The consistent difference in red fluorescence in fishes across a 15 m depth gradient is triggered by ambient brightness, not by ambient spectrum
Abstract
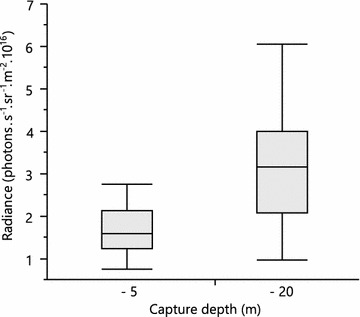
Background: Organisms adapt to fluctuations or gradients in their environment by means of genetic change or phenotypic plasticity. Consistent adaptation across small spatial scales measured in meters, however, has rarely been reported. We recently found significant variation in fluorescence brightness in six benthic marine fish species across a 15 m depth gradient. Here, we investigate whether this can be explained by phenotypic plasticity alone, using the triplefin Tripterygion delaisi as a model species. In two separate experiments, we measure change in red fluorescent brightness to spectral composition and ambient brightness, two central parameters of the visual environment that change rapidly with depth.
Results: Changing the ambient spectra simulating light at -5 or -20 m depth generated no detectable changes in mean fluorescence brightness after 4-6 weeks. In contrast, a reduction in ambient brightness generated a significant and reversible increase in mean fluorescence, most of this within the first week. Although individuals can quickly up- and down-regulate their fluorescence around this mean value using melanosome aggregation and dispersal, we demonstrate that this range around the mean remained unaffected by either treatment.
Conclusion: We show that the positive association between fluorescence and depth observed in the field can be fully explained by ambient light brightness, with no detectable additional effect of spectral composition. We propose that this change is achieved by adjusting the ratio of melanophores and fluorescent iridophores in the iris.
Figures


Similar articles
-
Fish with red fluorescent eyes forage more efficiently under dim, blue-green light conditions.BMC Ecol. 2017 Apr 20;17(1):18. doi: 10.1186/s12898-017-0127-y. BMC Ecol. 2017. PMID: 28427391 Free PMC article.
-
Regulation of red fluorescent light emission in a cryptic marine fish.Front Zool. 2014 Jan 8;11(1):1. doi: 10.1186/1742-9994-11-1. Front Zool. 2014. PMID: 24401080 Free PMC article.
-
Do the fluorescent red eyes of the marine fish Tripterygion delaisi stand out? In situ and in vivo measurements at two depths.Ecol Evol. 2018 Apr 15;8(9):4685-4694. doi: 10.1002/ece3.4025. eCollection 2018 May. Ecol Evol. 2018. PMID: 29760908 Free PMC article.
-
The cytoskeleton in fish melanophore melanosome positioning.Microsc Res Tech. 2002 Sep 15;58(6):464-9. doi: 10.1002/jemt.10164. Microsc Res Tech. 2002. PMID: 12242703 Review.
-
Are larvae of demersal fishes plankton or nekton?Adv Mar Biol. 2006;51:57-141. doi: 10.1016/S0065-2881(06)51002-8. Adv Mar Biol. 2006. PMID: 16905426 Review.
Cited by
-
Scorpionfish rapidly change colour in response to their background.Front Zool. 2023 Mar 3;20(1):10. doi: 10.1186/s12983-023-00488-x. Front Zool. 2023. PMID: 36864453 Free PMC article.
-
Anatomical Analysis of the Retinal Specializations to a Crypto-Benthic, Micro-Predatory Lifestyle in the Mediterranean Triplefin Blenny Tripterygion delaisi.Front Neuroanat. 2017 Dec 12;11:122. doi: 10.3389/fnana.2017.00122. eCollection 2017. Front Neuroanat. 2017. PMID: 29311852 Free PMC article.
-
Red fluorescence of the triplefin Tripterygion delaisi is increasingly visible against background light with increasing depth.R Soc Open Sci. 2017 Mar 22;4(3):161009. doi: 10.1098/rsos.161009. eCollection 2017 Mar. R Soc Open Sci. 2017. PMID: 28405391 Free PMC article.
-
Structural origins of coloration in the spider Phoroncidia rubroargentea Berland, 1913 (Araneae: Theridiidae) from Madagascar.J R Soc Interface. 2018 Feb;15(139):20170930. doi: 10.1098/rsif.2017.0930. J R Soc Interface. 2018. PMID: 29467259 Free PMC article.
-
Controlled iris radiance in a diurnal fish looking at prey.R Soc Open Sci. 2018 Feb 21;5(2):170838. doi: 10.1098/rsos.170838. eCollection 2018 Feb. R Soc Open Sci. 2018. PMID: 29515824 Free PMC article.
References
-
- Kawecki TJ, Ebert D. Conceptual issues in local adaptation. Ecol Lett. 2004;7(12):1225–1241. doi: 10.1111/j.1461-0248.2004.00684.x. - DOI
-
- Conover D, Clarke L, Munch S, Wagner G. Spatial and temporal scales of adaptive divergence in marine fishes and the implications for conservation. J Fish Biol. 2006;69(sc):21–47. doi: 10.1111/j.1095-8649.2006.01274.x. - DOI
Publication types
MeSH terms
LinkOut - more resources
Full Text Sources
Other Literature Sources
