

Accurate prediction of cellular co-translational folding indicates proteins can switch from post- to co-translational folding
- PMID: 26887592
- PMCID: PMC4759629
- DOI: 10.1038/ncomms10341
Accurate prediction of cellular co-translational folding indicates proteins can switch from post- to co-translational folding
Abstract
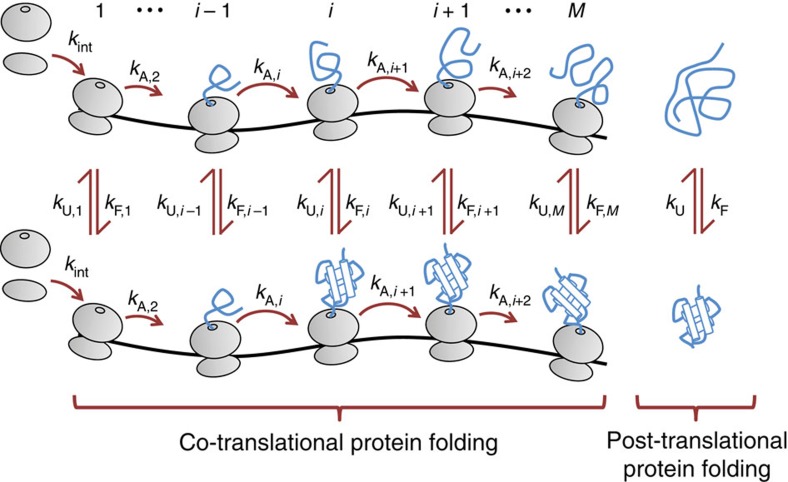
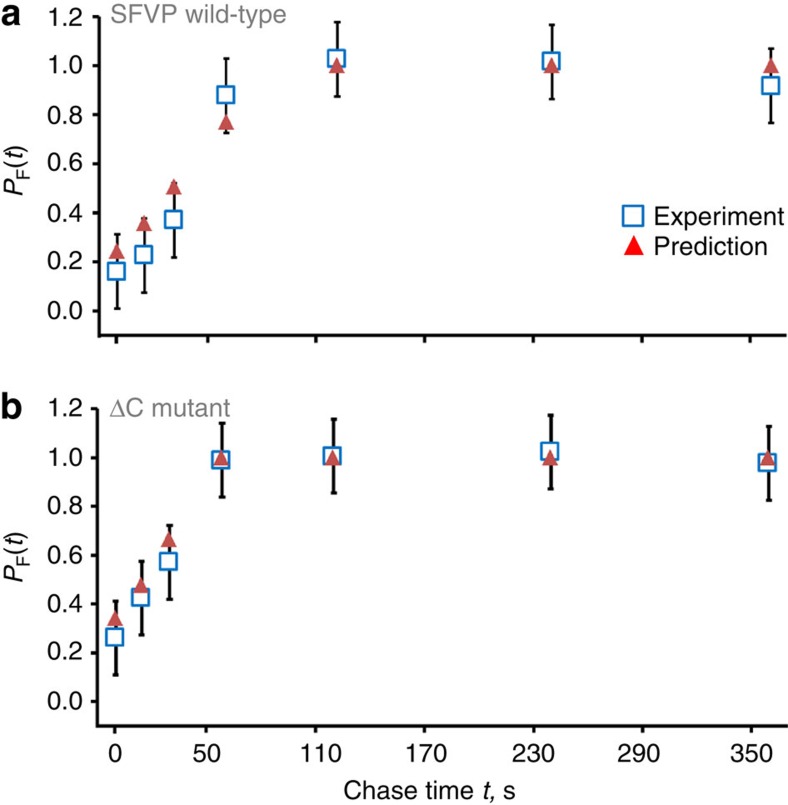
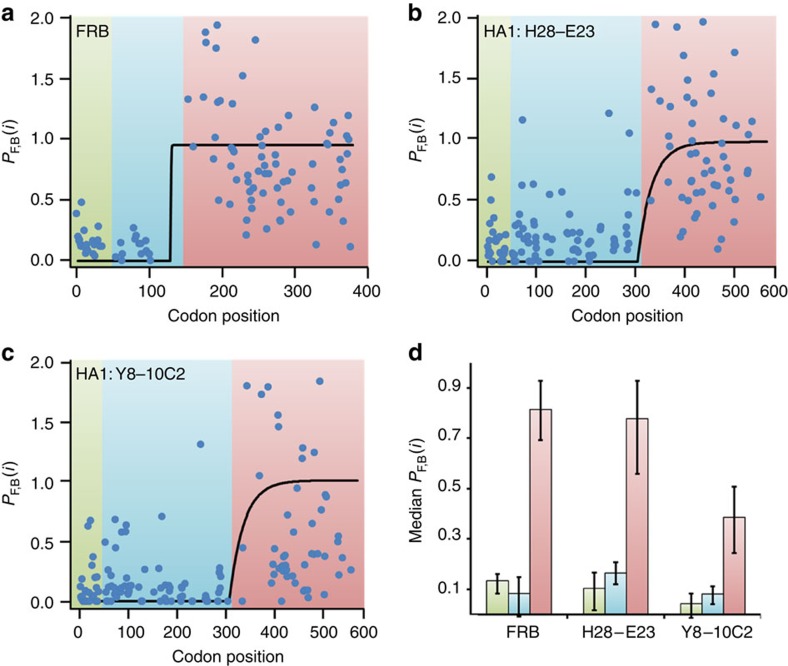
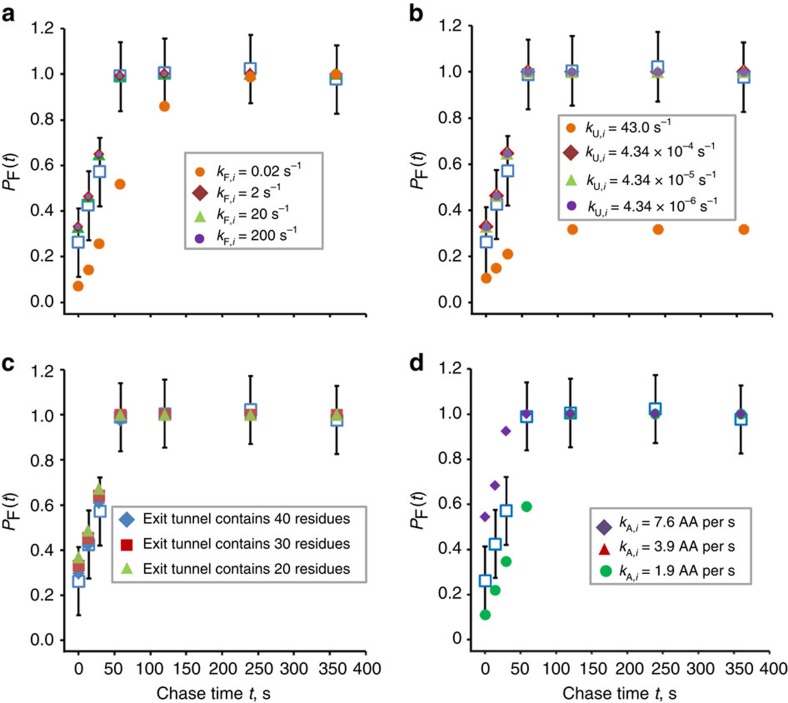
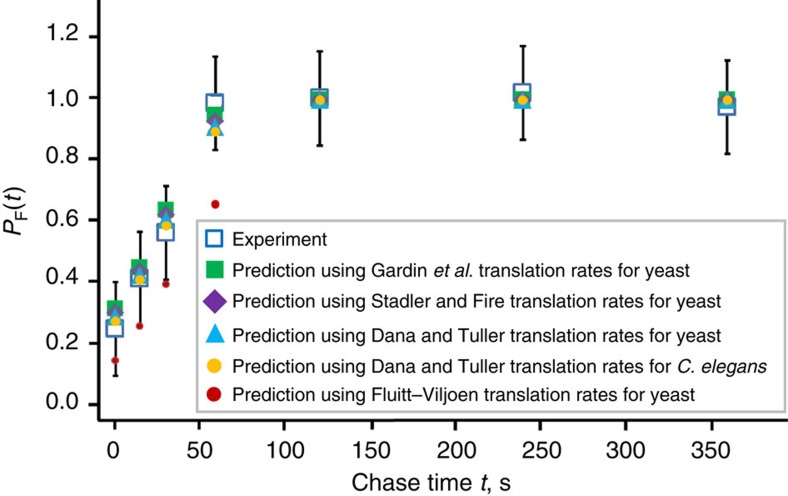
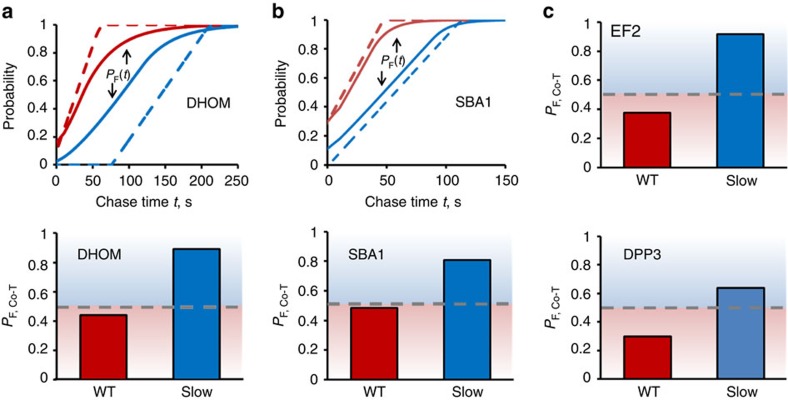
The rates at which domains fold and codons are translated are important factors in determining whether a nascent protein will co-translationally fold and function or misfold and malfunction. Here we develop a chemical kinetic model that calculates a protein domain's co-translational folding curve during synthesis using only the domain's bulk folding and unfolding rates and codon translation rates. We show that this model accurately predicts the course of co-translational folding measured in vivo for four different protein molecules. We then make predictions for a number of different proteins in yeast and find that synonymous codon substitutions, which change translation-elongation rates, can switch some protein domains from folding post-translationally to folding co-translationally--a result consistent with previous experimental studies. Our approach explains essential features of co-translational folding curves and predicts how varying the translation rate at different codon positions along a transcript's coding sequence affects this self-assembly process.
Figures
Similar articles
-
Folding at the birth of the nascent chain: coordinating translation with co-translational folding.Curr Opin Struct Biol. 2011 Feb;21(1):25-31. doi: 10.1016/j.sbi.2010.10.008. Epub 2010 Nov 24. Curr Opin Struct Biol. 2011. PMID: 21111607 Review.
-
[Synonymous Codon Usage-a Guide for Co-Translational Protein Folding in the Cell].Mol Biol (Mosk). 2019 Nov-Dec;53(6):883-898. doi: 10.1134/S0026898419060090. Mol Biol (Mosk). 2019. PMID: 31876270 Free PMC article. Review.
-
A pause for thought along the co-translational folding pathway.Trends Biochem Sci. 2009 Jan;34(1):16-24. doi: 10.1016/j.tibs.2008.10.002. Epub 2008 Nov 6. Trends Biochem Sci. 2009. PMID: 18996013 Review.
-
Kinetic modelling indicates that fast-translating codons can coordinate cotranslational protein folding by avoiding misfolded intermediates.Nat Commun. 2014;5:2988. doi: 10.1038/ncomms3988. Nat Commun. 2014. PMID: 24394622
-
The imprint of codons on protein structure.Biotechnol J. 2011 Jun;6(6):641-9. doi: 10.1002/biot.201000329. Epub 2011 May 13. Biotechnol J. 2011. PMID: 21567957 Review.
Cited by
-
The ribosome in action: Tuning of translational efficiency and protein folding.Protein Sci. 2016 Aug;25(8):1390-406. doi: 10.1002/pro.2950. Epub 2016 Jun 8. Protein Sci. 2016. PMID: 27198711 Free PMC article. Review.
-
Deciphering the rules of mRNA structure differentiation in Saccharomyces cerevisiae in vivo and in vitro with deep neural networks.RNA Biol. 2019 Aug;16(8):1044-1054. doi: 10.1080/15476286.2019.1612692. Epub 2019 May 23. RNA Biol. 2019. PMID: 31119975 Free PMC article.
-
A chemical kinetic basis for measuring translation initiation and elongation rates from ribosome profiling data.PLoS Comput Biol. 2019 May 23;15(5):e1007070. doi: 10.1371/journal.pcbi.1007070. eCollection 2019 May. PLoS Comput Biol. 2019. PMID: 31120880 Free PMC article.
-
The impact of ribosomal interference, codon usage, and exit tunnel interactions on translation elongation rate variation.PLoS Genet. 2018 Jan 16;14(1):e1007166. doi: 10.1371/journal.pgen.1007166. eCollection 2018 Jan. PLoS Genet. 2018. PMID: 29337993 Free PMC article.
-
Network measures for protein folding state discrimination.Sci Rep. 2016 Jul 28;6:30367. doi: 10.1038/srep30367. Sci Rep. 2016. PMID: 27464796 Free PMC article.
References
-
- Komar A. A. A pause for thought along the co-translational folding pathway. Trends Biochem. Sci. 34, 16–24 (2008) . - PubMed
-
- Kramer G., Boehringer D., Ban N. & Bukau B. The ribosome as a platform for co-translational processing, folding and targeting of newly synthesized proteins. Nat. Struct. Mol. Biol. 16, 589–597 (2009) . - PubMed
-
- O'Brien E. P., Ciryam P., Vendruscolo M. & Dobson C. M. Understanding the influence of codon elongation rates on cotranslational protein folding. Acc. Chem. Res. 47, 1536–1544 (2014) . - PubMed
-
- Kowarik M., Küng S., Martoglio B. & Helenius A. Protein folding during cotranslational translocation in the endoplasmic reticulum. Mol. Cell 10, 769–778 (2002) . - PubMed
Publication types
MeSH terms
Substances
LinkOut - more resources
Full Text Sources
Other Literature Sources
Molecular Biology Databases
