. 2016 Feb 18:6:21323.
doi: 10.1038/srep21323.

Temporal dynamics of Puumala hantavirus infection in cyclic populations of bank voles

Affiliations

Temporal dynamics of Puumala hantavirus infection in cyclic populations of bank voles

Liina Voutilainen et al. Sci Rep. .

Erratum in

Abstract

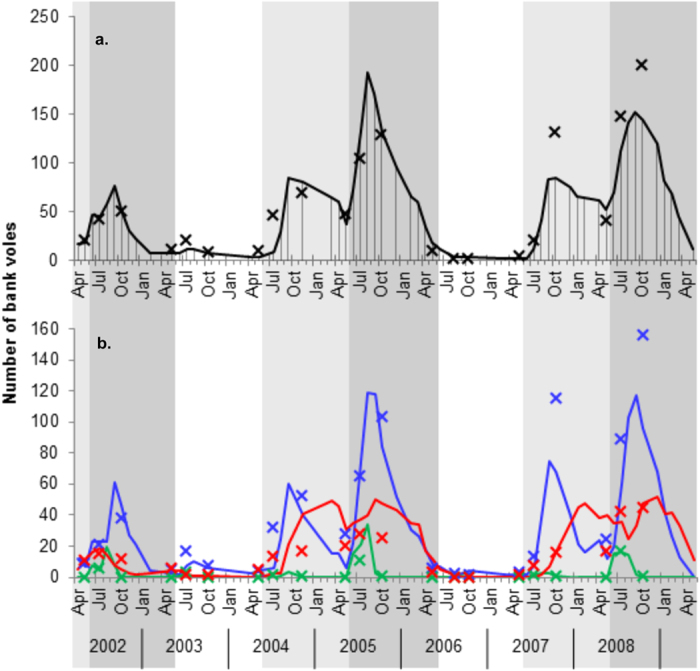
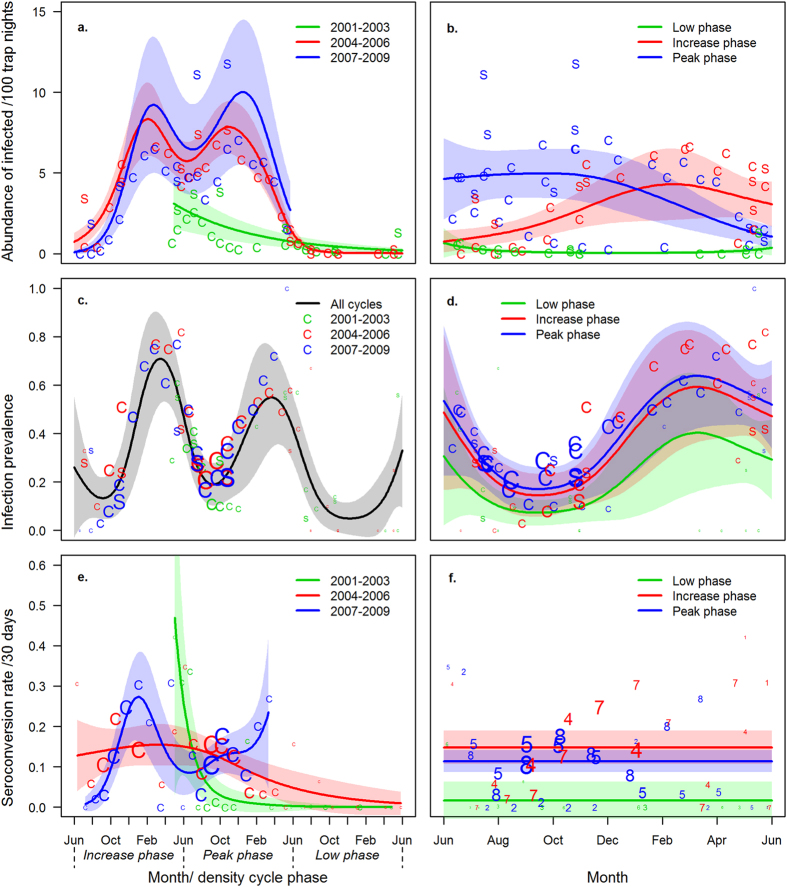
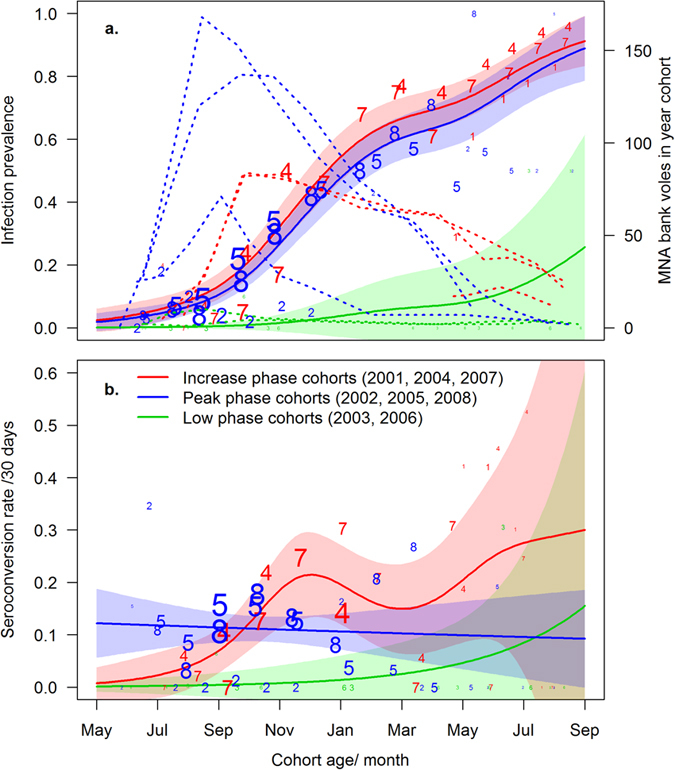
Understanding the dynamics of zoonotic pathogens in their reservoir host populations is a prerequisite for predicting and preventing human disease epidemics. The human infection risk of Puumala hantavirus (PUUV) is highest in northern Europe, where populations of the rodent host (bank vole, Myodes glareolus) undergo cyclic fluctuations. We conducted a 7-year capture-mark-recapture study to monitor seasonal and multiannual patterns of the PUUV infection rate in bank vole populations exhibiting a 3-year density cycle. Infected bank voles were most abundant in mid-winter months during years of increasing or peak host density. Prevalence of PUUV infection in bank voles exhibited a regular, seasonal pattern reflecting the annual population turnover and accumulation of infections within each year cohort. In autumn, the PUUV transmission rate tracked increasing host abundance, suggesting a density-dependent transmission. However, prevalence of PUUV infection was similar during the increase and peak years of the density cycle despite a twofold difference in host density. This may result from the high proportion of individuals carrying maternal antibodies constraining transmission during the cycle peak years. Our exceptionally intensive and long-term dataset provides a solid basis on which to develop models to predict the dynamic public health threat posed by PUUV in northern Europe.


Figures

Figure 1
Figure 1
The number of bank voles on the core (lines) and satellite grids (crosses), (a) in total and (b) according to PUUV infection status. Values for the 14 satellite grids are pooled. Shaded areas indicate phases (Jun 1st to May 31st) of increasing (light grey), peak (dark grey) and low (white) vole density. In a, vertical lines indicate trapping sessions on the core grid. In b, colours indicate infection status: susceptible for PUUV infection (blue), infected with PUUV (red), and MatAb+ (green).
Figure 2
Figure 2
Variation in the (a,b) abundance of PUUV-infected bank voles/100 trap nights, (c,d) PUUV infection prevalence, and (e,f) seroconversion rate within the time frame of (a,c,e) a vole density cycle and (b,d,f) a year. Lines represent predicted values for the core grid from the best-supported models ((a) cycle ID + s[cycle month by cycle ID]; (b) cycle phase + s[month by cycle phase]; (c) s[cycle month]; (d) cycle phase + s[month]; (e) cycle ID + s[cycle month by cycle ID]; (f) cycle phase; s[…] denote GAM smooth terms). Shaded areas indicate the 95% confidence intervals of parameter estimates. “C” and “S” in a−e denote observed data in core and pooled satellite grids, respectively. Numbers 1−8 in f denote biological years 2001−2008. The character sizes indicate the number of animals (c,d) and total days of exposure (e,f). Green, red, and blue colours indicate different cycles in (a,c,e) and different cycle phases in (b,d,f).
Figure 3
Figure 3
The (a) prevalence of PUUV infection and (a) seroconversion rate during the lifespan of a yearly bank vole cohort in relation to density cycle phase at birth. Solid lines represent predicted values from the best-supported models ((a) cycle phase + s[cohort age]; (b) cycle phase + s[cohort age by cycle phase]; s[…] denote GAM smooth terms). Shaded areas indicate the 95% confidence intervals of parameter estimates. Dashed lines in a indicate the total number of individuals in yearly cohorts, and colours denote the cycle phase at the summer of birth. Numbers 1−8 denote yearly cohorts 2001 to 2008, their size indicating the total (a) and the number of susceptible (b) animals.

References

    1. Mills J. N. & Childs J. E. Ecologic studies of rodent reservoirs: their relevance for human health. Emerg. Infect. Dis. 4, 529–537 (1998). - PMC - PubMed
    1. Jonsson C. B., Figueiredo L. T. & Vapalahti O. A global perspective on hantavirus ecology, epidemiology, and disease. Clin. Microbiol. Rev. 23, 412–441 (2010). - PMC - PubMed
    1. Guo W. et al. Phylogeny and origins of hantaviruses harbored by bats, insectivores, and rodents. PLoS Pathog. 9, 3159–3159 (2013). - PMC - PubMed
    1. Brummer-Korvenkontio M. et al. Nephropathia epidemica: detection of antigen in bank voles and serologic diagnosis of human infection. J. Infect. Dis. 141, 131–134 (1980). - PubMed
    1. Vapalahti O. et al. Hantavirus infections in Europe. Lancet Infect. Dis. 3, 653–661 (2003). - PubMed

Publication types