

doi: 10.1186/s13059-016-0888-1.
Classification of low quality cells from single-cell RNA-seq data
Affiliations
- PMID: 26887813
- PMCID: PMC4758103
- DOI: 10.1186/s13059-016-0888-1
Item in Clipboard
Classification of low quality cells from single-cell RNA-seq data
Genome Biol.
.
Abstract
Single-cell RNA sequencing (scRNA-seq) has broad applications across biomedical research. One of the key challenges is to ensure that only single, live cells are included in downstream analysis, as the inclusion of compromised cells inevitably affects data interpretation. Here, we present a generic approach for processing scRNA-seq data and detecting low quality cells, using a curated set of over 20 biological and technical features. Our approach improves classification accuracy by over 30 % compared to traditional methods when tested on over 5,000 cells, including CD4+ T cells, bone marrow dendritic cells, and mouse embryonic stem cells.
Figures
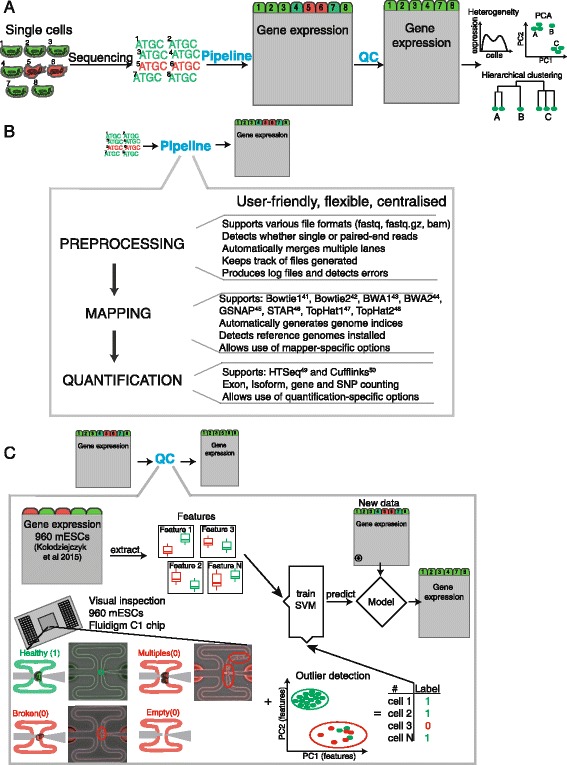
Overview of pipeline and quality control. a Schematic of RNA sequencing workflow. Green indicates high and red low quality cells. b Schematic of the computational pipeline developed to process large numbers of cells and RNA sequencing reads. c Overview of quality control method. Gene expression data for 960 mES cells were used to extract biological and technical features capable of identifying low quality cells. These features and microscopy annotations served as training data for a classification algorithm that is capable of predicting low quality cells in other datasets. Additional annotation of deceptive cells as low quality helps to improve classification accuracy
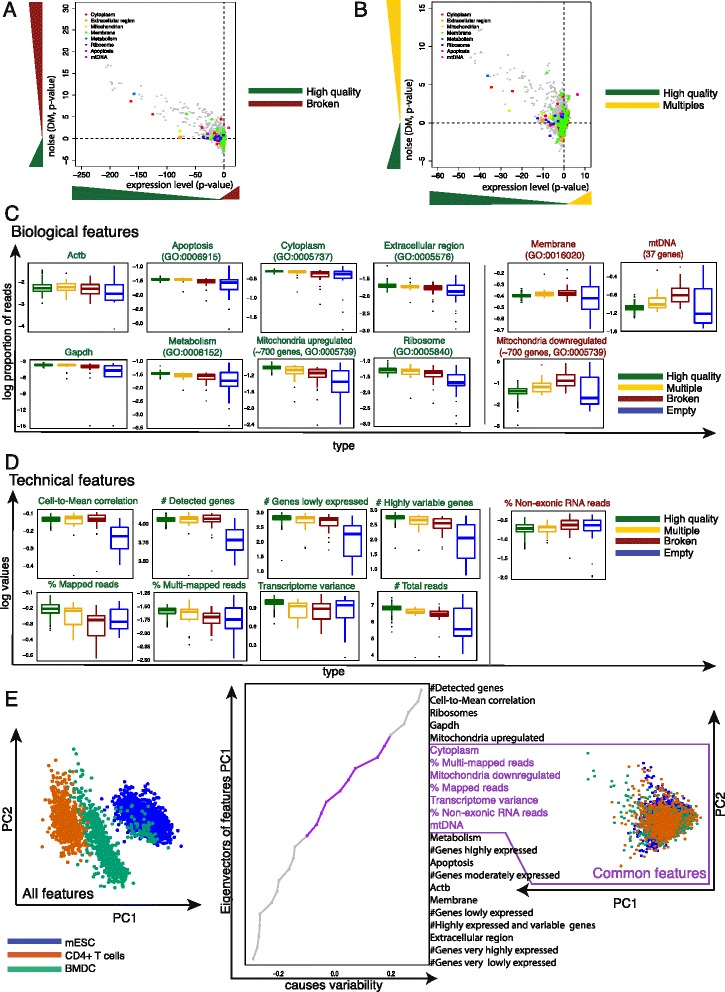
Biology and technical features of low quality cells. a, b Comparison of the levels of gene expression and noise for Gene Ontology (GO) terms between broken (a), multiples (b), and high quality cells. The logarithm (log10) of P values from a two-sided paired t-test using mean normalized read count (x-axis) and Distance-to-Median (DM) (y-axis) was computed for each GO category and plotted against each other by multiplying the sign of the t-statistic. c Boxplots of biological and d technical features comparing log10 transformed values (y-axis) between each type of low quality (multiple, broken, empty) and high quality cells (x-axis). Each dot corresponds to one cell. GO categories labeled green indicate upregulation in high quality cells. GO categories labeled red indicate upregulation in low quality cells. e Principal component analysis of single cells from different cell types. Cells from different experiments (or laboratories) but the same cell type are presented in the same color. Using all features results in a clear distinction between each type. Removing features causing this separation results in a set of common features applicable to any cell type and protocol
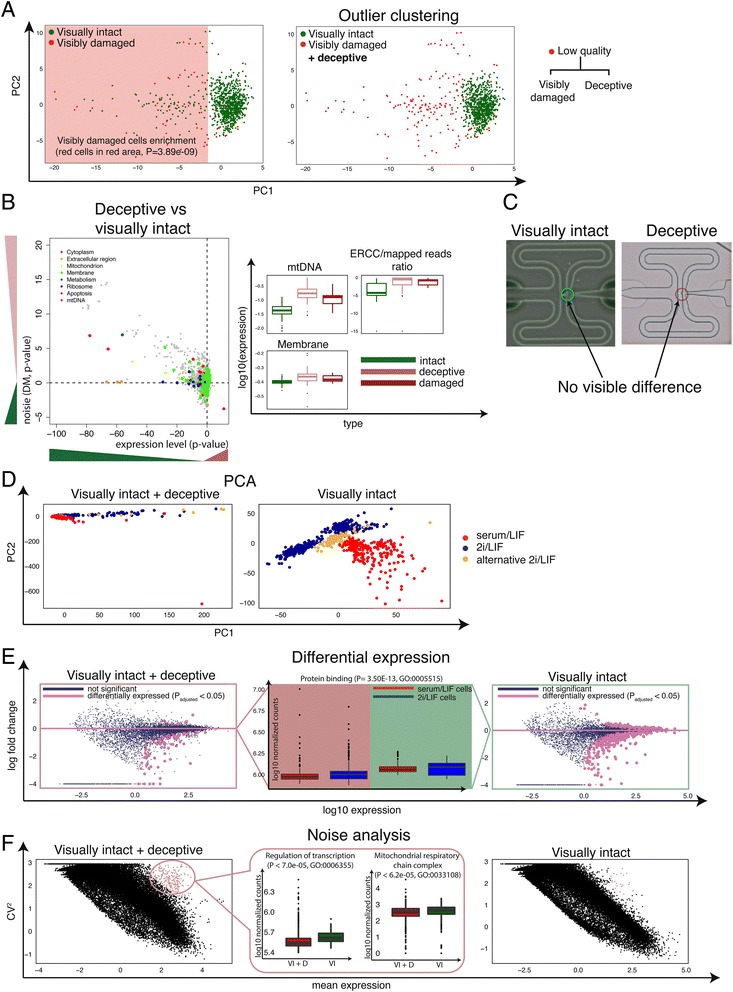
Deceptive cells appear intact but are low quality. a PCA of first two principal components of 960 mESCs using all features. There is a clear separation between visually intact and visibly damaged cells. However, a noticeable fraction of visibly intact cells clusters with visibly damaged cells, and we term these ‘deceptive’ cells, as they look intact but are most likely damaged inside. b Statistical test from 2A-B. Similarity in GO terms indicate that the deceptive cells are also likely broken. c-e Different types of analysis illustrating the effect of removing low quality cells based purely on visual damaged (left side), and in addition, deceptive cells (right) from the training set. c Microscopy images of two chambers from a Fluidigm C1 chip showing the similarity between a genuine visually intact, high quality cell, and one annotated as such but positioned as an outlier cell in the PCA. d Principal component analysis of the training set (serum/LIF, 2i/LIF, alternative 2i/LIF). e Differential expression between serum/LIF and 2i/LIF cells. Boxplots of protein binding enriched GO categories in the middle, illustrating change in gene expression levels when deceptive cells are excluded. f Coefficient of variation compared against mean expression of each gene. Boxplot in the middle illustrates the change in gene expression levels for two significantly enriched GO categories
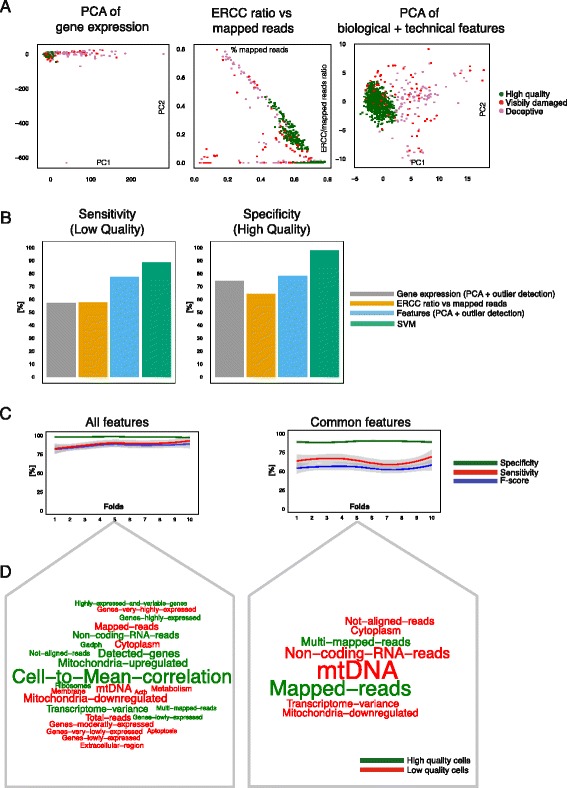
Identification of low quality cells. a Visualizing low and high quality cells with traditional and feature-based PCA method. The feature-based method makes it easier to detect low quality cells visually as most of them are outliers. b Accuracy measurements to evaluate the performance of each method. Sensitivity is defined as the proportion of correctly identified low quality cells. Specificity is defined as the proportion of correctly identified high quality cells. SVM outperforms all other methods as it has reasonable sensitivity and high specificity. c Comparing the effect of all versus common features upon the trained on SVM: all features result in higher sensitivity and specificity. F-score is defined as the harmonic mean between sensitivity and specificity. d Linear SVM feature weights illustrated as word clouds. Red features are informative for low quality and green features for high quality cells
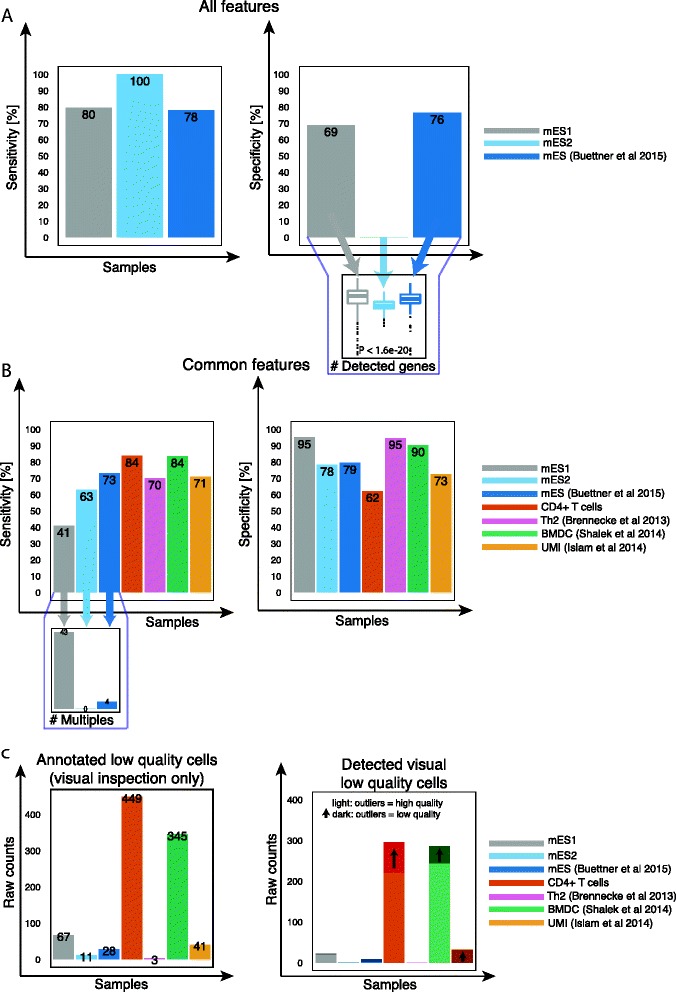
Classification accuracy of other cell types and protocols. a, b Sensitivity and specificity of each dataset considering (a) all features, (b) common features. c Number of annotated damaged cells based on C1 capture-site visual inspection and the corresponding detection rate using common features. Dark colors indicate improvement when deceptive cells are re-labeled as low quality cells
References
Publication types
MeSH terms
Substances
Grants and funding
LinkOut - more resources
Full Text Sources
Other Literature Sources
Molecular Biology Databases
Research Materials
