. 2016 Apr 15;291(16):8663-72.
doi: 10.1074/jbc.M115.693192. Epub 2016 Feb 17.

Differentiated, Promoter-specific Response of [4Fe-4S] NsrR DNA Binding to Reaction with Nitric Oxide

Affiliations

Differentiated, Promoter-specific Response of [4Fe-4S] NsrR DNA Binding to Reaction with Nitric Oxide

Jason C Crack et al. J Biol Chem. .

Abstract

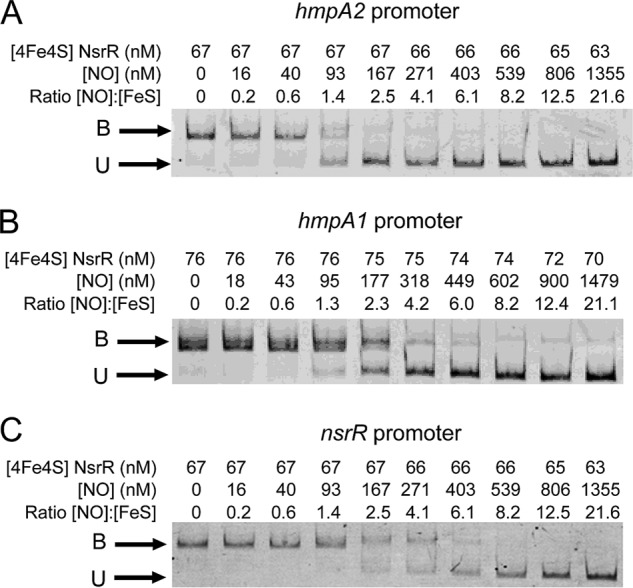
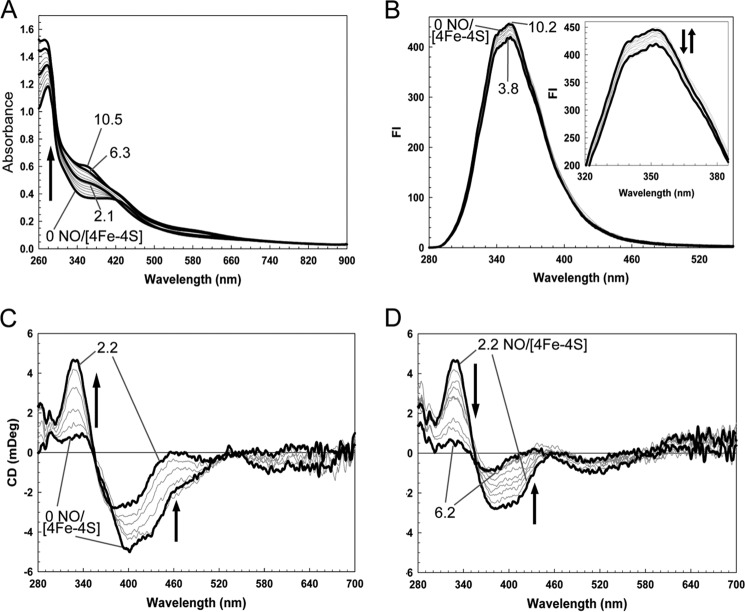
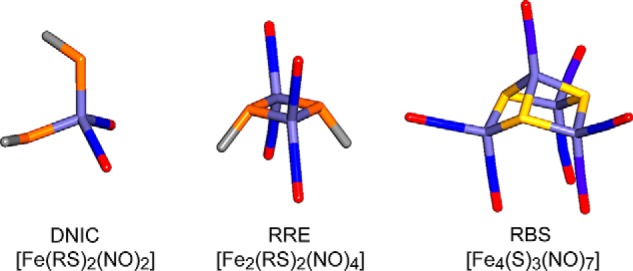
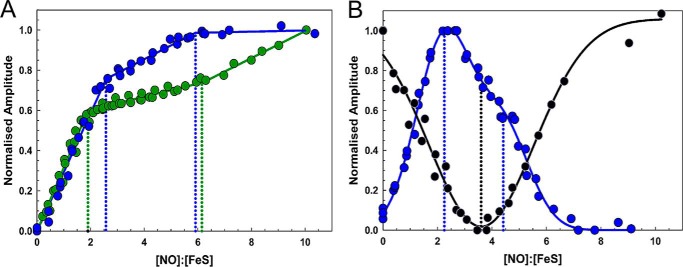
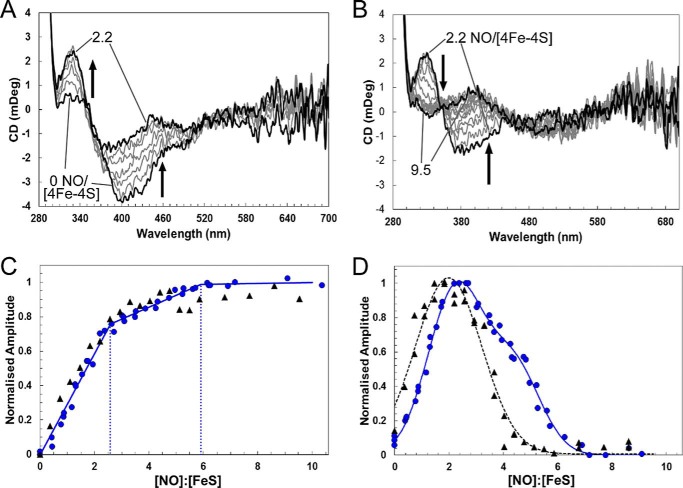
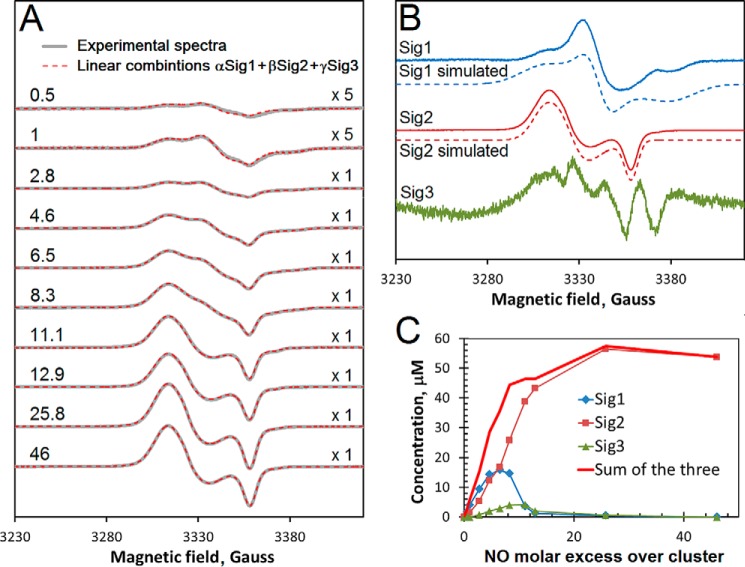
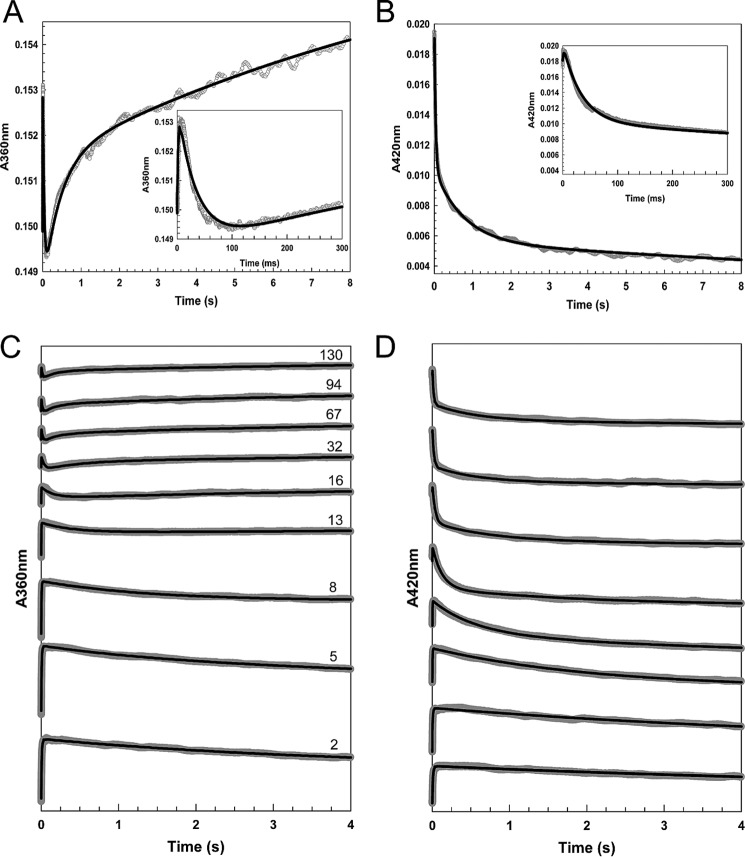
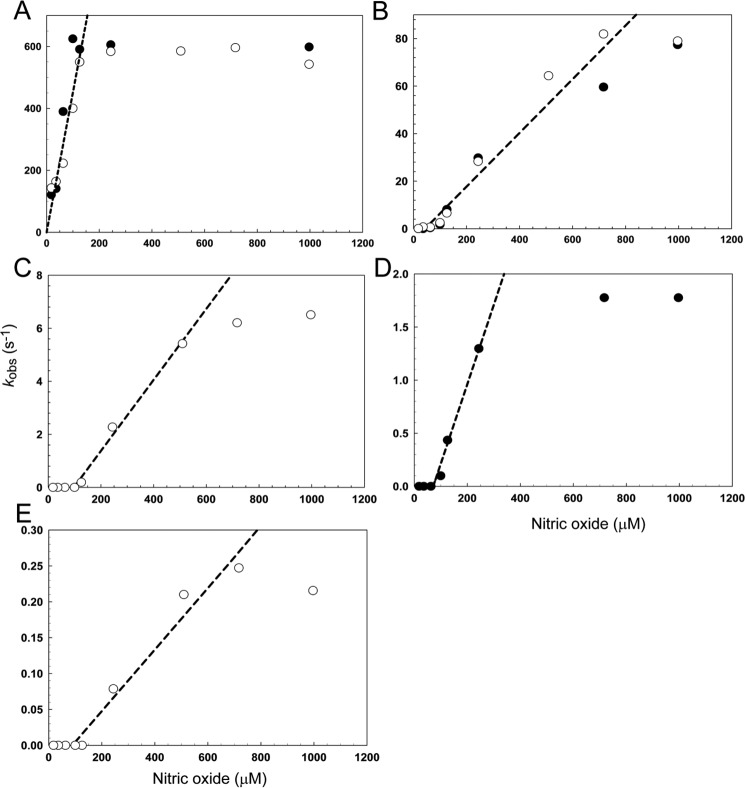
NsrR is an iron-sulfur cluster protein that regulates the nitric oxide (NO) stress response of many bacteria. NsrR from Streptomyces coelicolor regulates its own expression and that of only two other genes, hmpA1 and hmpA2, which encode HmpA enzymes predicted to detoxify NO. NsrR binds promoter DNA with high affinity only when coordinating a [4Fe-4S] cluster. Here we show that reaction of [4Fe-4S] NsrR with NO affects DNA binding differently depending on the gene promoter. Binding to the hmpA2 promoter was abolished at ∼2 NO per cluster, although for the hmpA1 and nsrR promoters, ∼4 and ∼8 NO molecules, respectively, were required to abolish DNA binding. Spectroscopic and kinetic studies of the NO reaction revealed a rapid, multi-phase, non-concerted process involving up to 8-10 NO molecules per cluster, leading to the formation of several iron-nitrosyl species. A distinct intermediate was observed at ∼2 NO per cluster, along with two further intermediates at ∼4 and ∼6 NO. The NsrR nitrosylation reaction was not significantly affected by DNA binding. These results show that NsrR regulates different promoters in response to different concentrations of NO. Spectroscopic evidence indicates that this is achieved by different NO-FeS complexes.

Keywords: DNA-binding protein; DNA-protein interaction; iron; iron-sulfur protein; nitric oxide; regulator; spectroscopy.


Figures

FIGURE 1.
FIGURE 1.
Effect of NO on ScNsrR DNA binding to NsrR-regulated promoters. A, titration of DNA probe (10.6 nm) containing the hmpA1 promoter with [4Fe-4S] NsrR following reaction with increasing concentrations of NO, as indicated. B, as in A, except that the DNA probe (5.9 nm) contained the hmpA2 promoter. C, as in A except that the DNA probe (4.6 nm) contained the nsrR promoter. The binding buffer contained 10 mm Tris, 54 mm KCl, 0.3% (v/v) glycerol, 1.32 mm GSH, pH 7.5.
FIGURE 2.
FIGURE 2.
Titrations of [4Fe-4S] ScNsrR with NO. A, absorbance spectra of [4Fe-4S] NsrR following sequential additions of NO up to a [NO]:[FeS] ratio of 10.5 (black lines show spectra recorded at ratios of 0, 2.1, 6.3, and 10.5). B, fluorescence spectra obtained during a titration equivalent to that in A; inset shows changes in more detail. Black lines show spectra recorded at [NO]:[FeS] ratios of 0 (lower) and 3.8 (upper). C and D, CD spectra obtained during a titration equivalent to that in A. Black lines show spectra recorded at [NO]:[FeS] ratios of 0 and 2.2 in C, and 2.2 and 6.2 in D. Arrows indicate the direction of intensity changes. ScNsrR (28 μm) was in 20 mm Tris, 20 mm MES, 20 mm Bistris propane, 100 mm NaCl, 250 μm GSH, 5% (v/v) glycerol, pH 8.0.
FIGURE 3.
FIGURE 3.
Iron-nitrosyl species that may be formed following nitrosylation of protein-bound FeS clusters. Structures of DNIC, RRE, and Roussin's black salt (RBS) species are illustrated. Thiolate (RS) groups are shown in orange, iron in light blue, nitrogen in dark blue, oxygen in red, and sulfide in yellow.
FIGURE 4.
FIGURE 4.
Plots of spectroscopic changes as a function of NO concentration. A, normalized A360 nmA420 nm (green circles) and CD430 nm (blue circles), and B, normalized CD330 nm (blue circles), and FI350 nm (black circles) plotted versus the [NO]:[FeS] ratio. Data are from two independent titrations (data for one of these are shown in Fig. 1).
FIGURE 5.
FIGURE 5.
The effect of DNA binding on [4Fe-4S] ScNsrR reaction with NO. CD spectra of [4Fe-4S] NsrR (16 μm [4Fe-4S] NsrR dimer, 32 μm [4Fe-4S]) following sequential additions of NO. A and B show CD spectra obtained during a titration equivalent to that in Fig. 2, C and D, in the presence of 32 μm dsDNA. Black lines show spectra recorded at [NO]:[FeS] ratios of 0 and 2.2 in A, and 2.2 and 9.5 in B. Arrows indicate the direction of intensity changes. ScNsrR was in 10 mm Tris, 54 mm KCl, 0.3% (v/v) glycerol, 1.5 mm GSH, pH 7.5. C and D, black triangles show normalized CD intensity at 430 and 330 nm, respectively, plotted versus the [NO]:[FeS] ratio for reaction in the presence of DNA. Equivalent data for reaction in the absence of DNA is replotted (blue circles) from Fig. 3 for comparison. Data are from two independent titrations (data for one are shown in A and B).
FIGURE 6.
FIGURE 6.
EPR analysis of DNIC formation during reaction of [4Fe-4S] NsrR with NO. A, EPR spectra following the addition of NO to 100 μm [4Fe-4S] NsrR (gray lines). The spectrum of NsrR prior to NO treatment was subtracted from each. The [NO]:[FeS] ratios are indicated. The first two spectra are magnified by a factor of 5 indicated by the “x” symbol (on the right). The experimental data are overlaid with linear combinations of the three EPR signals shown in B. The coefficients α, β, and γ used in these linear combinations are given in Table 1. B, the three EPR signals (solid lines) assumed to be basic components of all spectra shown in A, were obtained as described under ”Experimental Procedures.“ Signals 1 and 2 were simulated (dashed lines) with the following parameters: Sig1, gx = 2.0440, gy = 2.0246, and gz = 2.0000 (ΔHx = 25 G, ΔHy = 12 G, ΔHz = 25 G); Sig2, gx = 2.0426, gy = 2.0332, and gz = 2.0140 (ΔHx = 14 G, ΔHy = 14 G, ΔHz = 7 G). C, concentrations of the species responsible for EPR signals Sig1, Sig2, and Sig3 as functions of the excess of NO over cluster. Spectra were recorded at 77 K. Microwave power and frequency were 3.18 milliwatts and 9.47 GHz, respectively, and field modulation amplitude was 0.3 millitesla. The sample buffer was 50 mm Tris, 2 m NaCl, 5% (v/v) glycerol, pH 8.0.
FIGURE 7.
FIGURE 7.
Stopped-flow measurements of the reaction of [4Fe-4S] NsrR with NO. A–D, absorbance at 360 (A and B) and 420 nm (C and D) following the addition of NO to NsrR (∼7.6 μm). A and C show data at 360 and 420 nm, respectively, for the addition of ∼32 NO molecules per cluster. B and D show data at 360 and 420 nm, respectively, for a range of other NO:cluster ratios, as indicated. Insets in A and C show early events in the reaction time course. Fits to each of the observed phases (see ”Experimental Procedures“) are drawn in black lines.
FIGURE 8.
FIGURE 8.
Dependence of the observed rate constant for each step of nitrosylation on NO. A–E, plots of the observed (pseudo-first order) rate constant (kobs), obtained from fits of the kinetic data at 360 (open circles) and 420 nm (filled circles), over a range of NO concentrations. Note that panels A–E correspond to steps 1 to 5, respectively, of the reaction (see text). Least squares linear fits are shown giving apparent second order rate constants (see Table 2). The buffer was 20 mm Tris, 20 mm MES, 20 mm Bistris propane, 100 mm NaCl, 5% (v/v) glycerol, pH 8.0.

References

    1. Seth D., Hausladen A., Wang Y. J., and Stamler J. S. (2012) Endogenous protein S-nitrosylation in E. coli: regulation by OxyR. Science 336, 470–473 - PMC - PubMed
    1. Weiss B. (2006) Evidence for mutagenesis by nitric oxide during nitrate metabolism in Escherichia coli. J. Bacteriol. 188, 829–833 - PMC - PubMed
    1. Broillet M. C. (1999) S-Nitrosylation of proteins. Cell Mol. Life Sci. 55, 1036–1042 - PMC - PubMed
    1. Kwon Y. M., and Weiss B. (2009) Production of 3-nitrosoindole derivatives by Escherichia coli during anaerobic growth. J. Bacteriol. 191, 5369–5376 - PMC - PubMed
    1. Crack J. C., Green J., Thomson A. J., and Le Brun N. E. (2012) Iron-sulfur cluster sensor-regulators. Curr. Opin. Chem. Biol. 16, 35–44 - PubMed

Publication types

MeSH terms