. 2016 Apr 14;127(15):1886-95.
doi: 10.1182/blood-2015-11-681130. Epub 2016 Feb 17.

Galectin-1 drives lymphoma CD20 immunotherapy resistance: validation of a preclinical system to identify resistance mechanisms

Affiliations

Galectin-1 drives lymphoma CD20 immunotherapy resistance: validation of a preclinical system to identify resistance mechanisms

Jacquelyn M Lykken et al. Blood. .

Abstract

Non-Hodgkin lymphoma (NHL) is the most commonly diagnosed hematologic cancer of adults in the United States, with the vast majority of NHLs deriving from malignant B lymphocytes that express cell surface CD20. CD20 immunotherapy (rituximab) is widely used to treat NHL, even though the initial effectiveness of rituximab varies widely among patients and typically wanes over time. The mechanisms through which lymphomas initially resist or gain resistance to immunotherapy are not well established. To address this, a preclinical mouse model system was developed to comprehensively identify lymphoma transcriptomic changes that confer resistance to CD20 immunotherapy. The generation of spontaneous primary and familial lymphomas revealed that sensitivity to CD20 immunotherapy was not regulated by differences in CD20 expression, prior exposure to CD20 immunotherapy, or serial in vivo passage. An unbiased forward exome screen of these primary lymphomas was used to validate the utility of this expansive lymphoma cohort, which revealed that increased lymphoma galectin-1 (Gal-1) expression strongly correlated with resistance to immunotherapy. Genetically induced lymphoma Gal-1 expression ablated antibody-dependent lymphoma phagocytosis in vitro and lymphoma sensitivity to CD20 immunotherapy in vivo. Human NHLs also express elevated Gal-1 compared with nonmalignant lymphocytes, demonstrating the ability of this preclinical model system to identify molecular targets that could be relevant to human therapy. This study therefore established a powerful preclinical model system that permits the comprehensive identification of the dynamic lymphoma molecular network that drives resistance to immunotherapy.


Figures

Figure 1
Figure 1
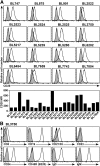
CD20 expression by spontaneous mouse primary B-cell lymphomas. (A) Representative CD20 expression by primary B-cell lymphomas isolated from Eµ-cMyc transgenic mice. Cell surface CD20 (open histograms) and isotype-matched control (shaded histograms) immunofluorescence staining were quantified by flow cytometry after brief periods of culture for 24 to 48 hours. The bar graph shows CD20 MFIs with isotype-matched control values subtracted. (B) Representative cell surface phenotype of the BL3750 lymphoma. Histograms show cell surface molecule staining (open histograms) vs isotype-matched control mAb staining (shaded histograms).
Figure 2
Figure 2
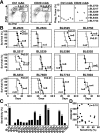
Lymphoma sensitivity to CD20 mAb. (A) CD20 mAb-induced lymphoma phagocytosis by macrophages. Peritoneal macrophages were cocultured for 24 hours with dye-labeled primary lymphoma cells previously incubated with control or CD20 mAb. Representative contour plots of F4/80+ macrophages vs labeled BL3750 cells show mean (± SEM) frequencies of phagocytosed lymphoma cells within the indicated gates (left and middle panels). The graph shows mean results for the indicated representative lymphomas (n = 2 experiments per group). (B-D) CD20 mAb-induced lymphoma clearance in vivo. Mice given 1 × 10⁵ primary lymphoma cells were treated with either CD20 (closed circles) or control (open circles) mAb 1 day later. (B) Kaplan-Meier survival plots of mice given the indicated lymphomas and CD20 or control mAb. Pooled results represent 2 to 3 independent experiments (n = 4-13 total mice per group) with significant cumulative survival differences between groups treated with CD20 vs control mAb indicated. (C) Primary lymphoma sensitivity to CD20 immunotherapy. Significant differences between sample means are indicated. **P ≤ .01. (D) CD20 expression (Figure 1A) and lymphoma sensitivity (B) to CD20 immunotherapy are not correlated.
Figure 3
Figure 3
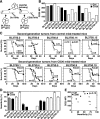
Second-generation lymphoma sensitivity to CD20 mAb. (A) Method for isolating second-generation BL3750 lymphomas from mice given primary cells. (B) CD20 expression by second-generation lymphomas with control mAb values subtracted. The gray bar indicates primary BL3750 cells; black bars indicate second-generation lymphomas from CD20 mAb-treated mice; white bars indicate second-generation lymphomas from control mAb-treated mice. (C) Second-generation lymphoma resistance to CD20 mAb is not driven by CD20 mAb selection in vivo. Mice were given second-generation lymphoma cells isolated from mice previously treated with either control (top panels) or CD20 (bottom panels) mAb’s as indicated. One day later, littermates were given either CD20 (closed circles) or control (open circles) mAb. Survival plots represent pooled results for 2 to 3 independent experiments (n = 5-15 mice per group) with significant differences between groups indicated. (D) Secondary lymphoma sensitivity to CD20 mAb as in Figure 2, with prior control or CD20 mAb exposure indicated. Significant differences between sample means are indicated. **P ≤ .01. (E) Second-generation lymphoma survival does not correlate with CD20 expression. Scatter plot comparing the percent sensitivity of secondary lymphoma cells with immunotherapy vs CD20 MFIs.
Figure 4
Figure 4
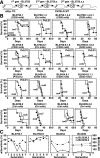
CD20 immunotherapy does not select for treatment-resistant lymphomas. (A) Method for isolating and naming representative BL3750 lymphoma family members. Primary lymphoma cells were transferred into mice that were then given either CD20 (closed circles) or control (open circles) mAb as in Figures 2 and 3. Second-generation lymphomas were subsequently collected and adoptively transferred as in Figure 3. This process was repeated for subsequent generations. (B) Representative changes in BL3750, BL6454, and BL5239 lymphoma family member sensitivities to CD20 immunotherapy during progressive in vivo passages. Whether the transferred lymphomas were primary lymphomas or were isolated from mice treated with either control or CD20 mAb is indicated. Survival plots represent pooled results for 2 to 3 independent experiments (n = 4-11 total mice per group). Significant cumulative survival differences between groups are indicated. (C) CD20 immunotherapy during progressive in vivo passages does not select for CD20-deficient lymphomas. Line graphs compare the sensitivity of representative lymphoma cells with CD20 immunotherapy (closed triangles) vs their CD20 expression levels (closed squares) over 3 to 7 generations for the lymphoma families shown in panel B.
Figure 5
Figure 5
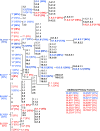
Cumulative family tree for spontaneous primary lymphomas. Lymphoma families were evaluated over multiple generations for their sensitivity to CD20 mAb as in Figure 4. Lymphomas isolated from either CD20 mAb-treated mice (bold text) or control mAb-treated mice (plain text) were either resistant (red) or sensitive (blue) to CD20 immunotherapy. Bracketed numbers indicate lymphoma sensitivity to CD20 immunotherapy. A total of 167 lymphomas have been isolated, including the following: primary (n = 22), secondary (n = 34), tertiary (n = 45), quaternary (n = 38), quinary (n = 18), senary (n = 7), and septenary (n = 3) generations within families. Asterisks indicate specific lymphomas analyzed as in Figures 1-6 (n = 53).
Figure 6
Figure 6
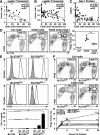
Lymphoma Gal-1 expression correlates with CD20 mAb resistance. (A-C) Gal-1 expression inversely correlates with lymphoma sensitivity to CD20 immunotherapy. Scatter plots compare normalized (A) and quantitative (B) Lgals1 transcript expression and Gal-1 secretion (C) relative to CD20 mAb sensitivity for each lymphoma analyzed. (D) Addition of Gal-1 blocks CD20 mAb-dependent phagocytosis of lymphoma cells. Peritoneal macrophages were cocultured with labeled BL3750 lymphoma cells as in Figure 2A, with or without CD20 mAb or rGal-1 added to the cultures as indicated. Each dot represents the results of individual experiments, with bars indicating means. (E) Representative GFP and cell surface CD20 expression by BL3750Ctrl or BL3750Gal-1 cells (open histograms) vs BL3750 cells (top panels, shaded histograms) or isotype-matched control mAb staining (middle panels, shaded histograms). Values represent mean (± SEM) Gal-1 secretion by BL3750, BL3750Ctrl, and BL3750Gal-1 cells (bottom panel, pooled results from 5 experiments). (F) Gal-1 blocks CD20 mAb-dependent phagocytosis of lymphoma. Peritoneal macrophages were cocultured for 24 hours with labeled BL3750Ctrl or BL3750Gal-1 lymphomas previously incubated with control (top panels) or CD20 mAb (middle panels), with representative contour plots showing F4/80 vs labeled BL3750 staining and mean (± SEM) frequencies of phagocytosed lymphomas cells shown. Values represent mean (± SEM) frequencies of BL3750Ctrl (circles) or BL3750Gal-1 (squares) previously incubated with control (open shapes), CD20 (closed shapes), or CD19 mAb (gray shapes) and cultured for 3, 6, and 24 hours with macrophages from 3 to 5 experiments (bottom panel, n = 7-20 mice per group).
Figure 7
Figure 7
Lymphoma Gal-1 expression in the local microenvironment confers CD20 mAb resistance in vivo. (A-B) Gal-1 expression blocks CD20-mediated lymphoma clearance in vivo. Mice given BL3750Ctrl or BL3750Gal-1 cells were treated with control (open shapes) or CD20 (closed shapes) mAb 1 day later. Lymphoma volume (2 experiments, top panels) and mouse survival (2-3 experiments, n = 4-10 mice per group, bottom panels) were monitored for 60 days post-mAb treatment. (B) Representative lymphomas (top panel) and serum Gal-1 (lower panel) was measured in naïve mice and littermates given lymphoma cells 45 days after CD20 mAb treatment (2-3 experiments, 10 mice per group). (C) Human LGALS1 expression (GSE2350) by naïve, centroblast (CB), centrocyte (CC), and memory B-cell samples (open circles) in comparison with cells (closed circles) from patients with Burkitt lymphoma (BL), CLL [blood cells (1) or blood CD19+ cells (2)], diffuse large B-cell lymphoma [DBCL; lymph node biopsy (1) or node biopsy CD19+ cells (2)], follicular lymphoma (FL), hairy cell leukemia (HCL), or mantle cell lymphoma (MCL). (E-I) Significant differences between sample means are indicated. *P ≤ .05; **P ≤ .01; ***P ≤ .001.

References

    1. American Cancer Society. Atlanta, GA: American Cancer Society; 2014. Cancer Facts & Figures 2014.
    1. Anderson KC, Bates MP, Slaughenhoupt BL, Pinkus GS, Schlossman SF, Nadler LM. Expression of human B cell-associated antigens on leukemias and lymphomas: a model of human B cell differentiation. Blood. 1984;63(6):1424–1433. - PubMed
    1. Maloney DG, Grillo-López AJ, Bodkin DJ, et al. IDEC-C2B8: results of a phase I multiple-dose trial in patients with relapsed non-Hodgkin’s lymphoma. J Clin Oncol. 1997;15(10):3266–3274. - PubMed
    1. Grillo-López AJ. Rituximab (Rituxan/MabThera): the first decade (1993-2003). Expert Rev Anticancer Ther. 2003;3(6):767–779. - PubMed
    1. Davis TA, Grillo-López AJ, White CA, et al. Rituximab anti-CD20 monoclonal antibody therapy in non-Hodgkin’s lymphoma: safety and efficacy of re-treatment. J Clin Oncol. 2000;18(17):3135–3143. - PubMed

Publication types