. 2016 Feb 17;36(7):2176-89.
doi: 10.1523/JNEUROSCI.3883-15.2016.

Dopaminergic Contributions to Vocal Learning

Affiliations

Dopaminergic Contributions to Vocal Learning

Lukas A Hoffmann et al. J Neurosci. .

Abstract

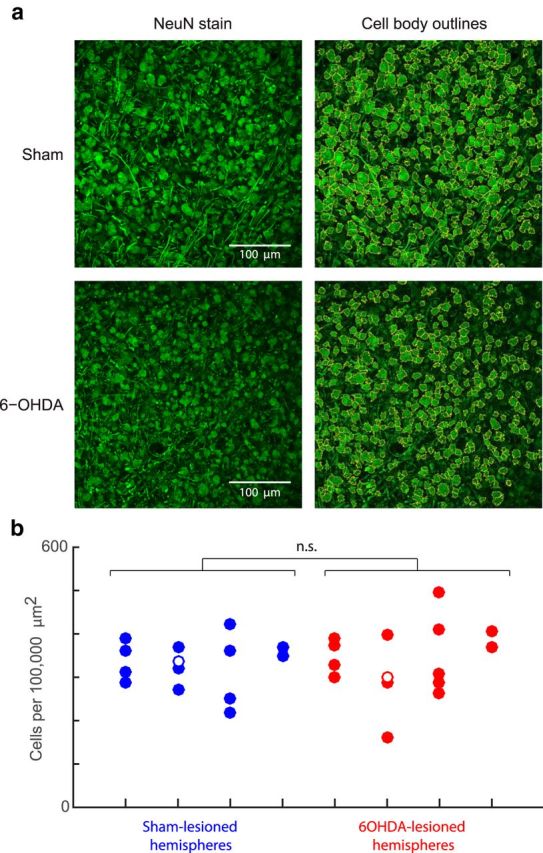
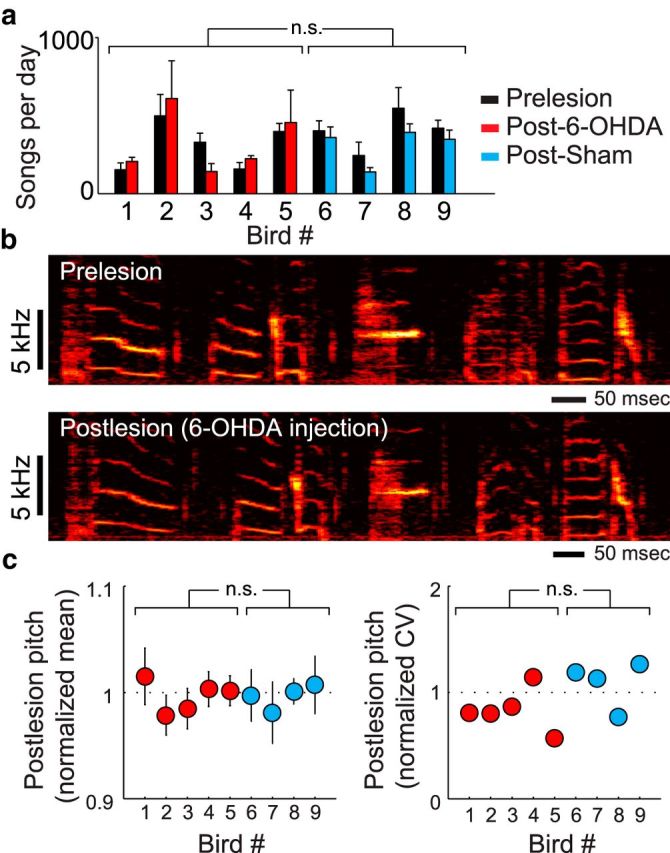
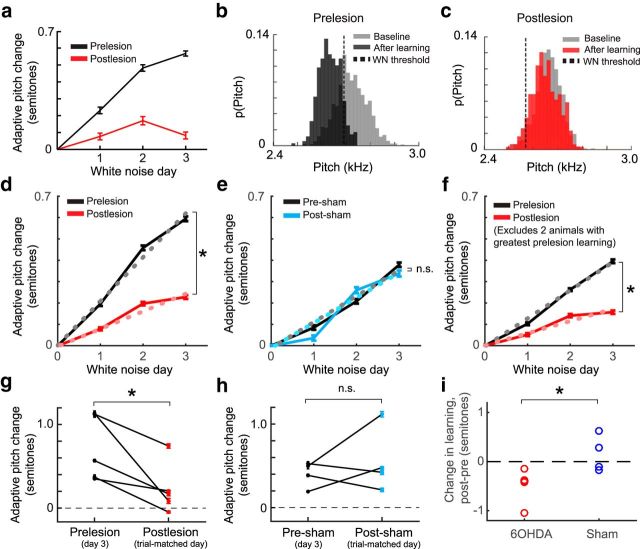
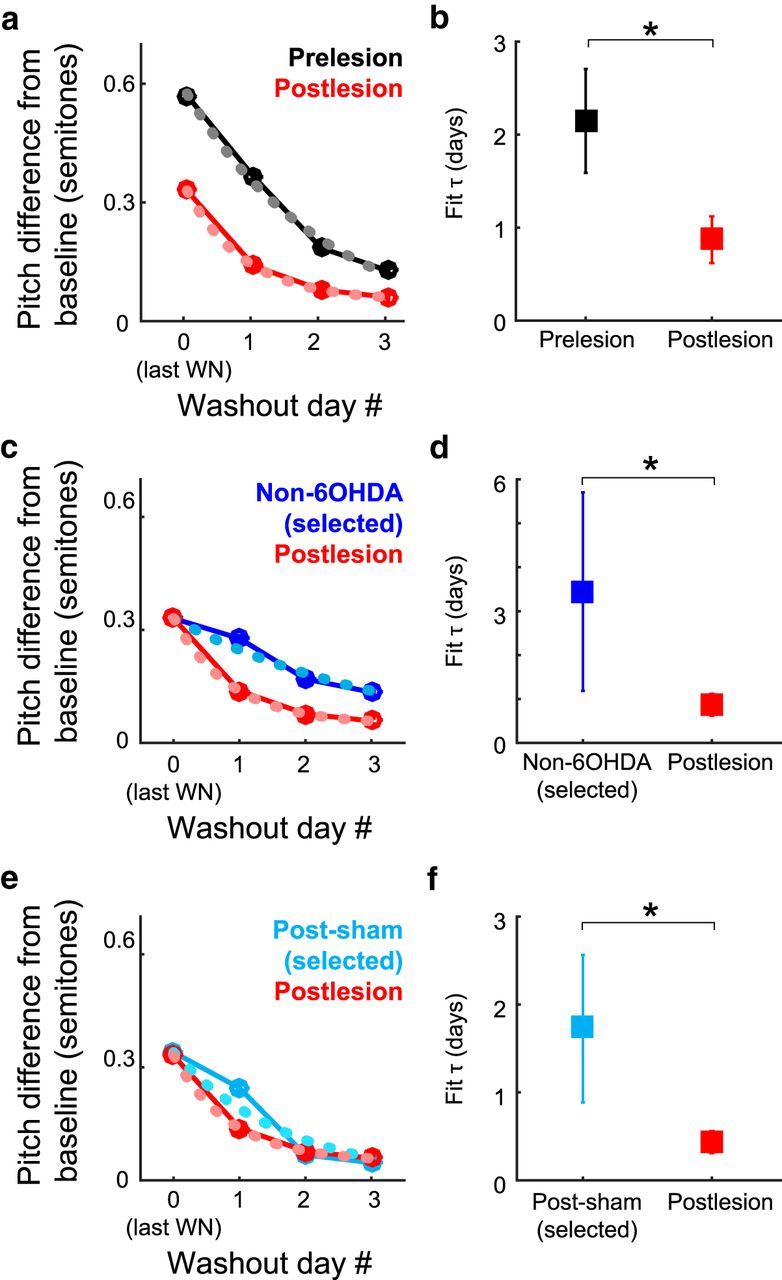
Although the brain relies on auditory information to calibrate vocal behavior, the neural substrates of vocal learning remain unclear. Here we demonstrate that lesions of the dopaminergic inputs to a basal ganglia nucleus in a songbird species (Bengalese finches, Lonchura striata var. domestica) greatly reduced the magnitude of vocal learning driven by disruptive auditory feedback in a negative reinforcement task. These lesions produced no measureable effects on the quality of vocal performance or the amount of song produced. Our results suggest that dopaminergic inputs to the basal ganglia selectively mediate reinforcement-driven vocal plasticity. In contrast, dopaminergic lesions produced no measurable effects on the birds' ability to restore song acoustics to baseline following the cessation of reinforcement training, suggesting that different forms of vocal plasticity may use different neural mechanisms.

Significance statement: During skill learning, the brain relies on sensory feedback to improve motor performance. However, the neural basis of sensorimotor learning is poorly understood. Here, we investigate the role of the neurotransmitter dopamine in regulating vocal learning in the Bengalese finch, a songbird with an extremely precise singing behavior that can nevertheless be reshaped dramatically by auditory feedback. Our findings show that reduction of dopamine inputs to a region of the songbird basal ganglia greatly impairs vocal learning but has no detectable effect on vocal performance. These results suggest a specific role for dopamine in regulating vocal plasticity.

Keywords: Bengalese finch; basal ganglia; dopamine; negative reinforcement; songbird; vocal learning.


Figures

Figure 1.
Figure 1.
A song-specific basal ganglia nucleus receives strong dopaminergic input. a, The song system includes area X, a basal ganglia nucleus critical for vocal learning. b, A parasagittal section stained for TH shows heavy label within the basal ganglia (blue dotted line) with especially strong label in area X (borders of X indicated by white triangles). TH stain also shows dopaminergic cell bodies in the VTA/SNc (red triangles) and their ascending axons (yellow triangles). c, Experimental design (see Materials and Methods).
Figure 2.
Figure 2.
Lesions of dopaminergic inputs to area X. a, Comparison of TH stain in sham (left) and 6-OHDA-lesioned (right) brains shows a reduction in the OD of stain in 6-OHDA-injected animals. b, To measure the loss of dopaminergic inputs, we used an OD threshold to divide images of area X into “lesioned” (white) and “nonlesioned” (black) subregions. Additionally, to quantify the location of lesions, we divided area X into dorsal, ventral, anterior, and posterior subregions. Red lines and letters indicate subregions that are both posterior and dorsal (PD), anterior and dorsal (AD), posterior and ventral (PV), and anterior and ventral (AV). Because all sections were cut parasagittally, medial and lateral subregions were designated by categorizing each section as belonging to either the medial or lateral half of area X. c, Using the binarization shown in b, we quantified the fraction of area X in which TH stain was reduced (αTotal; see Materials and Methods). d, We also quantified the density of TH-positive fibers both within and outside the lesioned subregion of area X (“lesioned ROI” and “nonlesioned ROI,” respectively) in individual histological sections. Examples of lesioned and nonlesioned ROIs are shown as filled and empty squares in a, respectively. e, Within each section, we normalized the fiber density in the lesioned ROI by the density in the nonlesioned ROI from the same image. Histogram and error bars indicate the mean ±SEM of this measure across five 6-OHDA-injected birds and one sham. *p < 0.05 (two-sided Kolmogorov–Smirnov tests). We obtained the same result when raw (un-normalized) fiber density measures were used.
Figure 3.
Figure 3.
Alternate method of quantifying loss of TH label. In our primary analysis of lesion size (see Materials and Methods; Fig. 2b), we manually set an OD threshold to quantify the fraction of area X in which TH stain was reduced in each histological section. Here we present an alternate analysis (see Alternate analysis of OD) that does not rely on a within-image threshold but rather simply measured the mean OD across all of area X in each section. a, Comparison of TH stain in sham (left) and 6-OHDA-lesioned (right) brains, showing the same sections as in Figure 2a. To measure the loss of dopaminergic inputs, in each histological section, we quantified the OD of TH stain across all of area X (purple) in the adjacent striatum (orange). b, Analysis of the ratio of OD in area X to that in striatum. In nearly all sections from sham-lesioned birds, TH stain is darker in area X than in surrounding striatum (OD ratio > 1). In 6-OHDA-injected birds (red trace), 50% of sections (horizontal black line) of area X had an OD ratio below the 95th percentile of the sham distribution (gray region). b, Red and blue symbols represent measurements taken from the left and right panels shown in a, respectively.
Figure 4.
Figure 4.
Concentrations of DA and NE in 6-OHDA- and sham-lesioned tissue. As described in Materials and Methods, we used HPLC to directly measure the concentration of DA and NE in birds that received 6-OHDA lesions of area X in one hemisphere and sham lesions in the other hemisphere. a, In sham-lesioned hemispheres (filled symbols), the concentration of NE was extremely small relative to that of DA, with NE concentrations on average 1.2% as great as that of DA (range 0.5%–1.6%). Injections of 6-OHDA significantly reduced the concentration of DA (*p < 0.05, one-sample Kolmogorov–Smirnov test on normalized DA concentrations in the lesioned hemisphere) but did not significantly affect concentrations of NE. (p > 0.8; one-sample Kolmogorov–Smirnov test on normalized NE concentrations in the lesioned hemisphere). b, Expanded view of NE data; note the difference in vertical scale between a and b. n.s., Not significant.
Figure 5.
Figure 5.
6-OHDA injections do not lead to neuron loss within area X. a, Representative NeuN-stained images from birds that received sham (top) and 6-OHDA (bottom) lesions. In each section, we counted the number of neuronal cell bodies (right column; see Materials and Methods). b, Area X images were taken from two bilaterally and two unilaterally lesioned birds (each 369 × 369 μm). Blue and red circles represent the number of cell bodies in individual sections. Open circles represent the values for the example sham and 6-OHDA lesions shown in a. All images from 6-OHDA-injected hemispheres were taken from within subregions of area X that exhibited significant loss of TH staining. We did not detect a significant difference in the number of cell bodies in area X in 6-OHDA versus sham conditions (p > 0.7, partial F test; see Materials and Methods). This suggests that, while lesions decreased dopaminergic inputs to area X (Figs. 2, 3, 4), 6-OHDA injections did not kill neurons with cell bodies within area X. n.s., Not significant.
Figure 6.
Figure 6.
Removal of DA inputs to area X does not degrade song quantity or quality. a, The number of song bouts produced per day did not significantly differ in 6-OHDA-injected versus sham-lesioned animals (see Results). b, Spectrograms represent the acoustic power (color scale) at different frequencies as a function of time for two representative samples of a bird's song before (top) and 5 d after (bottom) bilateral 6-OHDA injections into area X. c, Across animals, there were no consistent differences in the mean (left) or variability (CV; right) of the pitch of the song syllables targeted with white noise when the postlesion data were normalized by their prelesion values (p > 0.5, Kolmogorov–Smirnov tests) in birds receiving 6-OHDA injections (red) or sham lesions (blue). n.s., Not significant.
Figure 7.
Figure 7.
Removal of DA inputs to area X impairs reinforcement-driven vocal learning. a, In an example experiment, a bird received 3 d of training in which higher-pitched renditions of a syllable were punished by a disruptive auditory stimulus (see Materials and Methods). Black and red traces represent the pitch of the targeted syllable (mean ± SEM) before and after 6-OHDA injections, respectively, and illustrate a substantial reduction in learning magnitude following lesion. Pitch changes in the adaptive direction (downwards) are plotted as positive values. b, c, Prelesion (b) and postlesion (c) pitch distributions for the experiment shown in a. Gray bars represent the 3 d baseline pitch distribution. Dashed lines indicate the threshold for white noise playback (i.e., any pitches sung above that threshold received white noise). In every experiment, learning was driven in the same syllable and in the same direction prelesion and postlesion. d, Group data for lesioned (6-OHDA-injected) animals. Solid lines indicate the pitch of the targeted syllable as in a, except that here data are combined across n = 5 lesioned animals. Dotted lines indicate linear regression to pitch data. *p < 0.0001, significantly different slopes (F test). e, Group data for n = 4 sham-lesioned animals, plotting and testing conventions as in d. Slopes of pitch as a function of time are not significantly different (p = 0.48, F test). f, Alternate analysis of data from 6-OHDA-lesioned animals, excluding the two subjects who showed the greatest prelesion learning (see Results and g). Plotting and testing conventions as in d; pitch slopes are significantly different (*p < 0.0001, F test). g, Adaptive pitch change on the last white noise day in the prelesion experiment (relative to baseline) versus adaptive pitch change on a trial-matched white noise day in the postlesion experiment (not necessarily day 3; see Materials and Methods). *p < 0.05, significant difference in prelesion and postlesion learning magnitude (one-sided Wilcoxon signed-rank test). h, Adaptive pitch change on the last white noise day for sham-lesioned animals (conventions as in g). i, Direct comparison between sham and 6-OHDA learning changes. *p < 0.05 (two-sample t test). n.s., Not significant.
Figure 8.
Figure 8.
Removal of DA inputs to area X does not impair pitch restoration. a, Combined data across five 6-OHDA-lesioned birds during the restoration period, after white noise was discontinued. Washout day 0 is the last day of white noise (not necessarily day 3; see Materials and Methods). Black and red represent prelesion and postlesion experiments, respectively. Prelesion and postlesion restoration data were fit with an exponential decay model (dashed lines; see Materials and Methods). Birds restored pitch toward baseline in both prelesion and postlesion experiments. After 6-OHDA lesions, birds began with a lower absolute pitch difference from baseline because of postlesion learning deficits (Fig. 7d). b, Fitted time constant τ for prelesion and postlesion learning. Lower τ indicates faster return to baseline. In postlesion experiments, birds restored pitch significantly faster than in prelesion experiments (*p < 0.05, permutation test). Error bars indicate 95% confidence intervals. c, d, Same analysis as in a, b, but selecting nonlesioned datasets so as to approximately equalize the initial error (i.e., to approximately equalize error on the last white noise day). Here nonlesioned datasets are selected from prelesion, presham, and postsham subjects (see Materials and Methods). e, f, Same analysis as in c, d, but with nonlesioned datasets drawn only from postsham subjects. Note different vertical scale in d compared with that in b, f. a, c, e, SEM error bars are obscured by the plotted circles. *

Similar articles

Cited by

References

    1. Ali F, Otchy TM, Pehlevan C, Fantana AL, Burak Y, Ölveczky BP. The basal ganglia is necessary for learning spectral, but not temporal, features of birdsong. Neuron. 2013;80:1–13. doi: 10.1016/j.neuron.2013.09.017. - DOI - PMC - PubMed
    1. Andalman AS, Fee MS. A basal ganglia-forebrain circuit in the songbird biases motor output to avoid vocal errors. Proc Natl Acad Sci U S A. 2009;106:12518–12523. doi: 10.1073/pnas.0903214106. - DOI - PMC - PubMed
    1. Beeler JA, Cao ZF, Kheirbek MA, Ding Y, Koranda J, Murakami M, Kang UJ, Zhuang X. Dopamine-dependent motor learning insight into Levodopa's long-duration response. Ann Neurol. 2010;67:639–647. doi: 10.1002/ana.21947. - DOI - PMC - PubMed
    1. Bottjer SW, Altenau B. Parallel pathways for vocal learning in basal ganglia of songbirds. Nat Neurosci. 2010;13:153–155. doi: 10.1038/nn.2472. - DOI - PMC - PubMed
    1. Brainard MS, Doupe AJ. Interruption of a basal ganglia-forebrain circuit prevents plasticity of learned vocalizations. Nature. 2000;404:762–766. doi: 10.1038/35008083. - DOI - PubMed

Publication types

LinkOut - more resources