. 2016 Feb 17;36(7):2212-26.
doi: 10.1523/JNEUROSCI.3543-15.2016.

Distinct β Band Oscillatory Networks Subserving Motor and Cognitive Control during Gait Adaptation

Affiliations

Distinct β Band Oscillatory Networks Subserving Motor and Cognitive Control during Gait Adaptation

Johanna Wagner et al. J Neurosci. .

Abstract

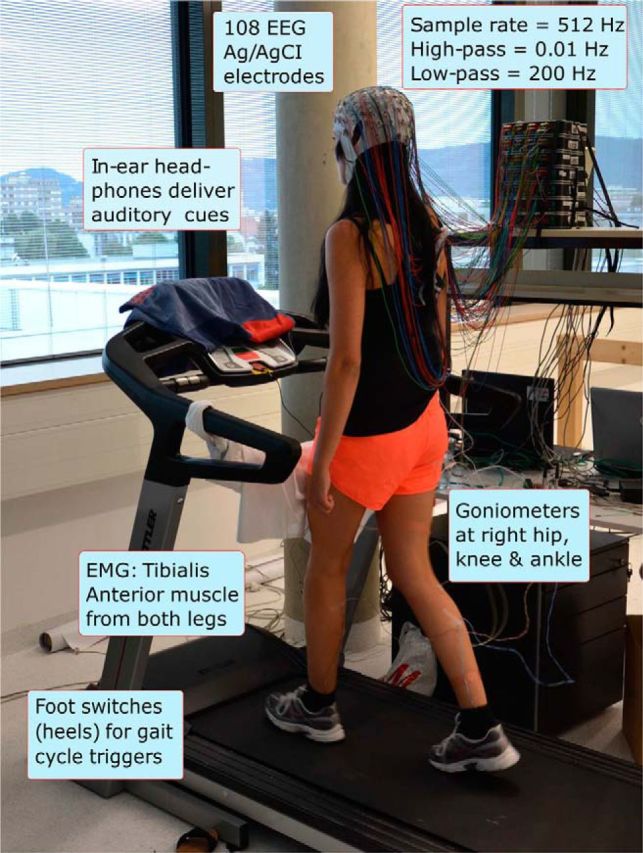
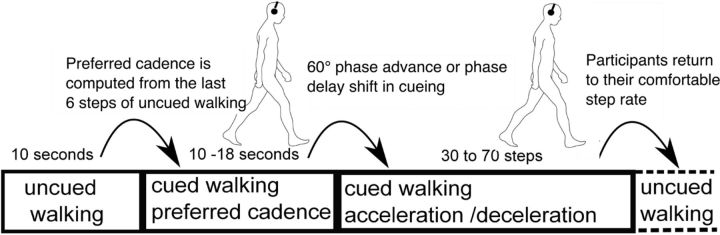
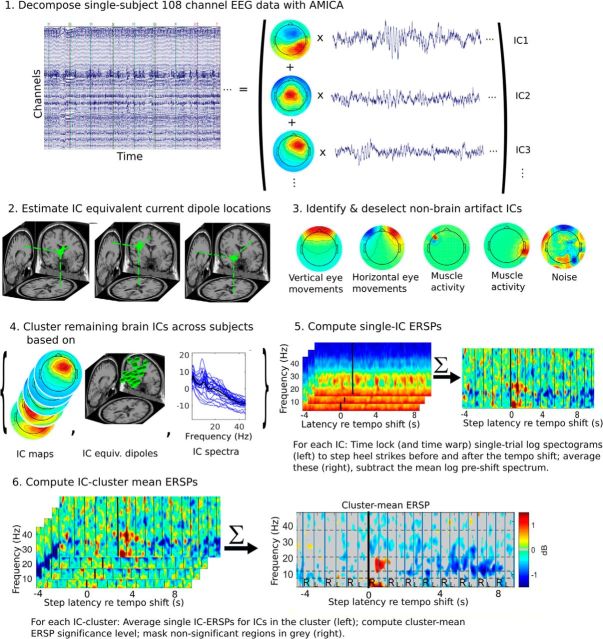
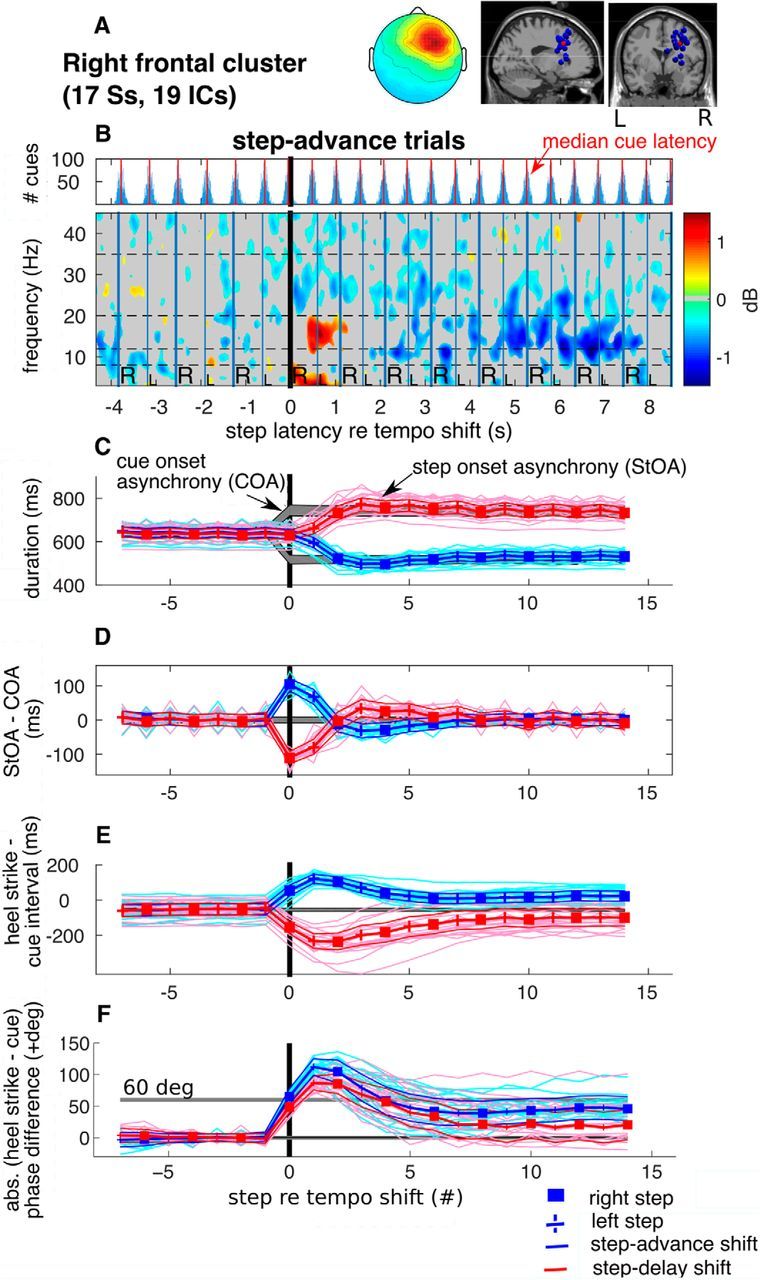
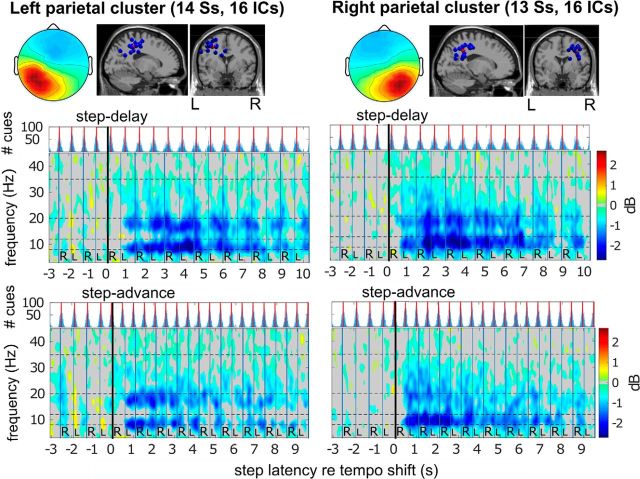
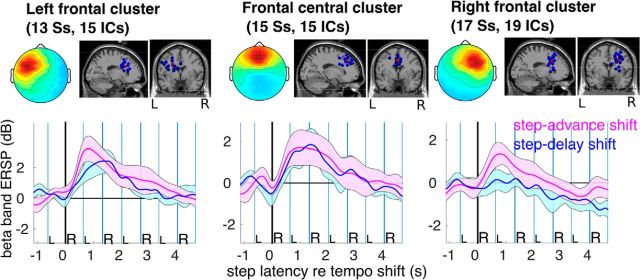
Everyday locomotion and obstacle avoidance requires effective gait adaptation in response to sensory cues. Many studies have shown that efficient motor actions are associated with μ rhythm (8-13 Hz) and β band (13-35 Hz) local field desynchronizations in sensorimotor and parietal cortex, whereas a number of cognitive task studies have reported higher behavioral accuracy to be associated with increases in β band power in prefrontal and sensory cortex. How these two distinct patterns of β band oscillations interplay during gait adaptation, however, has not been established. Here we recorded 108 channel EEG activity from 18 participants (10 males, 22-35 years old) attempting to walk on a treadmill in synchrony with a series of pacing cue tones, and quickly adapting their step rate and length to sudden shifts in pacing cue tempo. Independent component analysis parsed each participant's EEG data into maximally independent component (IC) source processes, which were then grouped across participants into distinct spatial/spectral clusters. Following cue tempo shifts, mean β band power was suppressed for IC sources in central midline and parietal regions, whereas mean β band power increased in IC sources in or near medial prefrontal and dorsolateral prefrontal cortex. In the right dorsolateral prefrontal cortex IC cluster, the β band power increase was stronger during (more effortful) step shortening than during step lengthening. These results thus show that two distinct patterns of β band activity modulation accompany gait adaptations: one likely serving movement initiation and execution; and the other, motor control and inhibition.

Significance statement: Understanding brain dynamics supporting gait adaptation is crucial for understanding motor deficits in walking, such as those associated with aging, stroke, and Parkinson's. Only a few electromagnetic brain imaging studies have examined neural correlates of human upright walking. Here, application of independent component analysis to EEG data recorded during treadmill walking allowed us to uncover two distinct β band oscillatory cortical networks that are active during gait adaptation to shifts in the tempo of an auditory pacing cue: (8-13 Hz) μ rhythm and (13-35 Hz) β band power decreases in central and parietal cortex and (14-20 Hz) β band power increases in frontal brain areas. These results provide a fuller framework for electrophysiological studies of cortical gait control and its disorders.

Keywords: EEG; gait adaptation; independent component analysis; motor inhibition; rhythmic auditory cueing; β band oscillations.


Figures

Figure 1.
Figure 1.
Experimental setup. Participant walking on the treadmill with auditory pacing cues delivered through in-ear headphones. During the initial training period, treadmill speed (3–3.5 km/h) was adjusted to the most comfortable pace for each participant and thereafter remained constant.
Figure 2.
Figure 2.
Experimental paradigm. Throughout the session, treadmill speed remained fixed at a rate comfortable to the participant. During each approximately minute-long trial, participants first walked for ∼10 s without auditory cues, then walked for 10–18 s synchronous with cue tones delivered at their then-prevailing step rate and phase. Thereafter, beginning at a right heel strike, a sudden (accelerated or decelerated) tempo shift occurred in the pacing cue sequence. In response, participants were instructed to adapt their step length, rate, and phase as quickly as possible so as to again synchronize their steps with the cue tones at the new tempo. After 30–70 steps, the next trial began immediately, returning again to 10 s of uncued walking during which participants were instructed to return to their most comfortable step rate.
Figure 3.
Figure 3.
Schematic overview of the EEG data-processing pipeline. (1) Single-subject data are decomposed by AMICA into maximally IC time courses (traces) with spatially fixed projections (scalp maps). (2) Single equivalent current dipole locations are estimated. (3) Nonbrain artifact sources are identified and removed from further processing. (4) Brain source ICs are clustered across subjects based on their scalp maps, dipole locations, and log power spectra. (5) Single trial spectrograms and mean, base spectrum-removed ERSP for one IC. (6) Single-IC ERSPs and IC cluster-mean ERSP relative to step-advance time shifts for the right frontal cluster.
Figure 4.
Figure 4.
ERSP image and behavioral adaptation following tempo shifts. A, Cluster mean scalp projection map and equivalent dipole locations of cluster ICs (blue spheres) and their centroid (red sphere) visualized in the MNI template brain and centered in r-dlPFC. B, Cue latency histograms (above) and cluster mean ERSP image (below) for the r-dlPFC IC source cluster in step-advance (step shortening) trials. Single-trial spectrograms were computed between −4 and 10 s around the first time-shifted cue (0 s indicates the target right heel strike). To construct the group-mean ERSP for each subject, the single-trial EEG spectrograms were first time warped to the group-median latencies of the heel strikes during the imaged interval (red vertical lines in the cue latency histograms). Relative changes in spectral power were obtained by subtracting the mean log spectrum in the interval −4 s to −0.5 s before the shifts. Nonsignificant changes from baseline are masked in gray. Vertical lines indicate right and left heel strikes. R's and L's indicate right and left foot placements, respectively. Dashed horizontal lines indicate α (8–13 Hz), lower β (13–20 Hz), and upper β (20–35 Hz) bands. The ERSP plot shows, first, a synchronization in the β band between the second and third heel strikes following the tempo shift, and then later a desynchronization with respect to baseline. C, Behavioral record: Median step onset asynchronies (StOAs) (blue and red traces) for each subject in the two conditions (step advance and delay), and cue onset asynchronies (COAs) (gray traces) in milliseconds. D, Difference between StOA and COA at each step; this reflects adaptation of step frequency to the perturbed pacing cue tempo. E, Time intervals (in milliseconds) between heel strikes and nearest cue onsets reflect sensorimotor synchronization performance (e.g., step adaptation to the tempo-shifted cue sequence). F, Absolute step-cue phase difference (in degrees of the baseline cue cycle).
Figure 5.
Figure 5.
ERPs time-locked to cues and steps at tempo shifts in cue advance, cue delay, and control cue no tempo shift conditions for frontal, temporal, and central midline clusters. Zero marks (A) the first cue indicating a tempo shift (Rcue), (B) the step (Rstep) related to Rcue, or (A, B) simply the cue/step during steady-state walking (control condition). Dashed vertical lines mark right (Rstep) and left (Lstep) heel strikes. Continuous vertical lines mark cues (Rcue, Lcue) related to Rstep and Lstep, and the expected occurrence of cues (expcue) at tempo shifts. Event-locked time courses indicate averaged cluster ERPs relative to cue/step -advance (pink), -delay (blue), and -no tempo shift (black). Envelopes represent 90% confidence intervals around means. A, During all three conditions (cue advance, cue delay, and cue no shift), cue-locked ERPs feature a prominent negative deflection near 100 ms (right frontal cluster) or 150 ms (left temporal cluster). Frontal central and right frontal cluster ERPs include a positive peak near 250 ms after tempo shifts for cue delay and 300–400 ms for cue advance but are absent for the cue no shift condition. In the central midline cluster, following cue delay tempo shifts, a negative peak appears near 250 ms. Following cue advance tempo shifts, a small but significant negative deflection occurs 100 ms later. B, Step-locked ERPs exhibit similar but smaller ERP peaks 250–300 ms after Rstep.
Figure 6.
Figure 6.
Equivalent dipole source locations and cluster-mean scalp projections and ERSP images for IC source clusters centered in temporal and frontal cortex. From left to right in each row, Mean scalp projection; equivalent dipole locations of cluster ICs; cue onset histogram and cluster-mean ERSP images time-locked to (left) step lengthening (step delay) and (right) shortening (step advance) tempo shifts as marked by the onset of the first time-shifted cue (the nearest cue to the right heel strike at 0 s). Single-trial log spectrograms were time warped to median step latencies before averaging. Mean log power at each frequency from −4 s to −0.5 s before the tempo shift was subtracted to obtain relative changes in log spectral power. Nonsignificant changes from baseline are masked in gray. All three IC clusters show increases in mean β band power between the second and fourth heel strikes following the shift.
Figure 7.
Figure 7.
Significant ERSP differences between adaptations to step-advance and step-delay tempo shifts for an IC cluster centered in right dorsolateral frontal cortex. Top, Mean scalp projection and equivalent dipole locations of cluster ICs. Bottom (above), Cue tone onset histograms and (below left, center) cluster-mean ERSP images for step-delay and step-advance trials, respectively, time-locked (0 s) to the right heel strike nearest to the first tempo-shifted cue tone, and (right) the difference between these two adaptation responses. Significance of condition differences was estimated using a bootstrap approach corrected for multiple comparisons using false discovery rate. Nonsignificant differences are masked in gray. The difference ERSP shows a stronger β band power increase near the second and third post-shift steps in the step-advance condition than in (subjectively easier) step-delay adaptations.
Figure 8.
Figure 8.
Equivalent dipole source locations and cluster-mean scalp projections and ERSP images for an IC source cluster centered in the supplementary motor area. Cluster-mean ERSP images time-locked to step lengthening and step shortening tempo shifts include desynchronization in the upper β band (25–35 Hz).
Figure 9.
Figure 9.
Equivalent dipole source locations and cluster-mean scalp projections and ERSP images for IC source clusters in left and right parietal cortex. Cluster-mean ERSP images for step-delay and step-advance conditions were computed and visualized as in Figure 4. Single-trial spectrograms were time warped to median step latencies for heel strikes −7 to 15 before and after tempo shift onsets. ERSP images show long-lasting, shift-induced decreases in α and β band power maximal just before heel strikes of the foot contralateral to the cortical location.
Figure 10.
Figure 10.
β-band spectral perturbations in frontal clusters. Individual β frequency bands were selected for each individual subject as the frequency within the range 14–20 Hz having maximal ERSP power variance. For statistical analysis, mean β-band ERSP time courses time-locked to step-advance and step-delay tempo shifts were computed. Heel strike events were time warped to the same (median) latencies in step-delay and step-advance shift trials. Blue and pink lines and areas represent mean β band power as a function of trial latency and its 95% confidence interval. Only the right frontal cluster shows a significant difference between step advances and step delays (note the nonoverlapping confidence intervals).

Similar articles

Cited by

References

    1. Androulidakis AG, Doyle LM, Yarrow K, Litvak V, Gilbertson TP, Brown P. Anticipatory changes in beta synchrony in the human corticospinal system and associated improvements in task performance. Eur J Neurosci. 2007;25:3758–3765. doi: 10.1111/j.1460-9568.2007.05620.x. - DOI - PubMed
    1. Arnal LH, Giraud AL. Cortical oscillations and sensory predictions. Trends Cogn Sci. 2012;16:390–398. doi: 10.1016/j.tics.2012.05.003. - DOI - PubMed
    1. Aron AR, Robbins TW, Poldrack RA. Inhibition and the right inferior frontal cortex: one decade on. Trends Cogn Sci. 2014;18:177–185. doi: 10.1016/j.tics.2013.12.003. - DOI - PubMed
    1. Aschersleben G, Prinz W. Synchronizing actions with events: the role of sensory information. Percept Psychophys. 1995;57:305–317. doi: 10.3758/BF03213056. - DOI - PubMed
    1. Aschersleben G, Prinz W. Delayed auditory feedback in synchronization. J Mot Behav. 1997;29:35–46. doi: 10.1080/00222899709603468. - DOI - PubMed

Publication types

LinkOut - more resources