. 2016 Feb 17;36(7):2267-82.
doi: 10.1523/JNEUROSCI.2645-15.2016.

Guidance of Axons by Local Coupling of Retrograde Flow to Point Contact Adhesions

Affiliations

Guidance of Axons by Local Coupling of Retrograde Flow to Point Contact Adhesions

Robert H Nichol IV et al. J Neurosci. .

Abstract

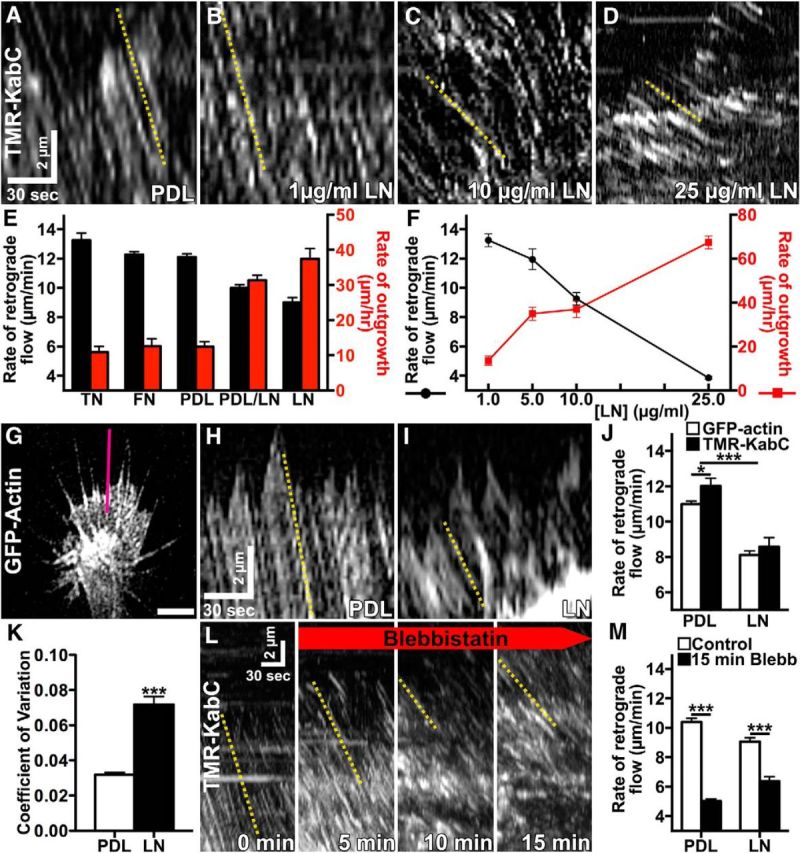
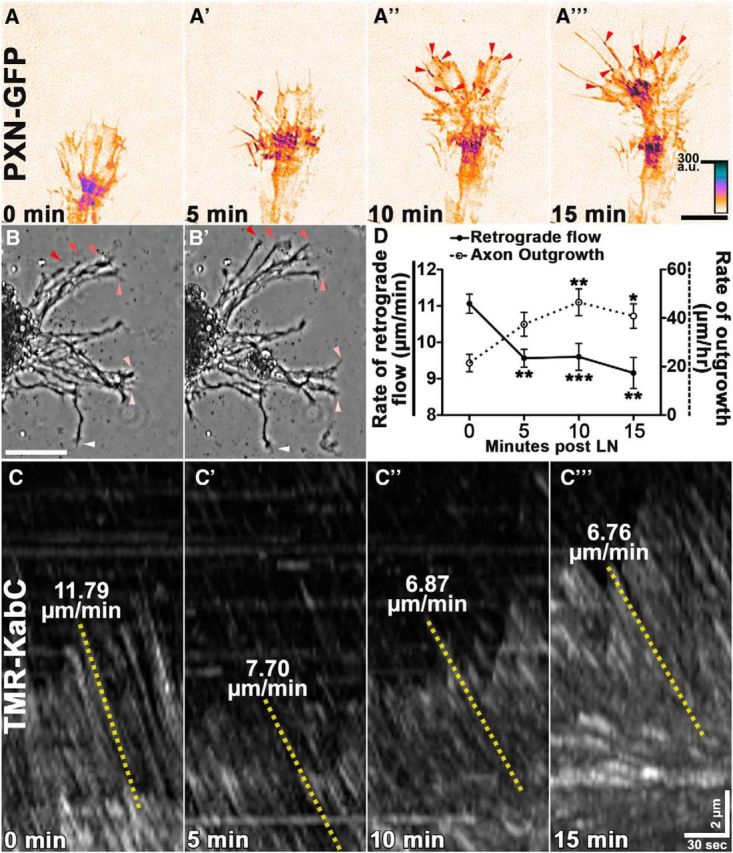
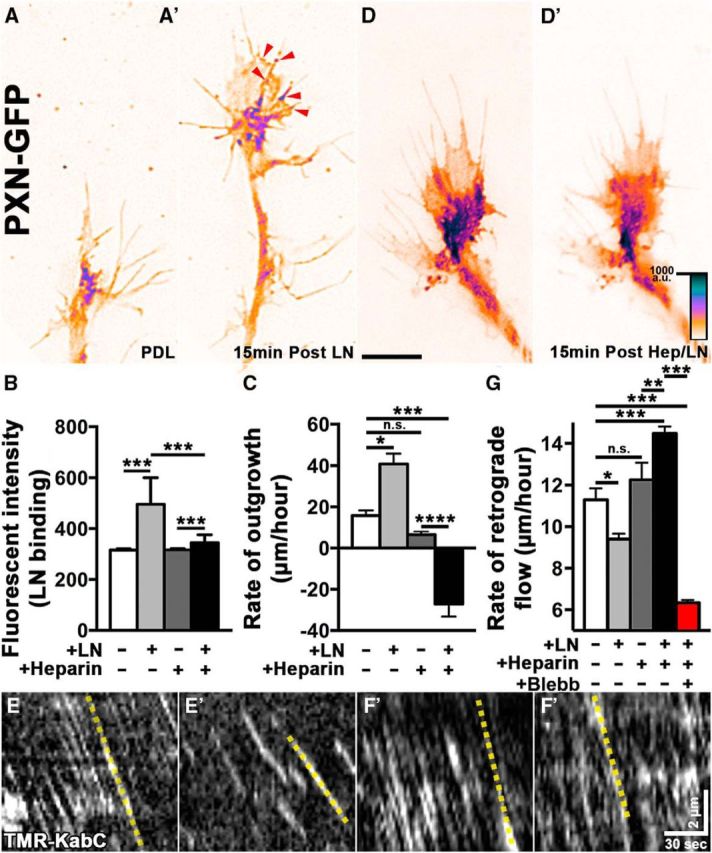
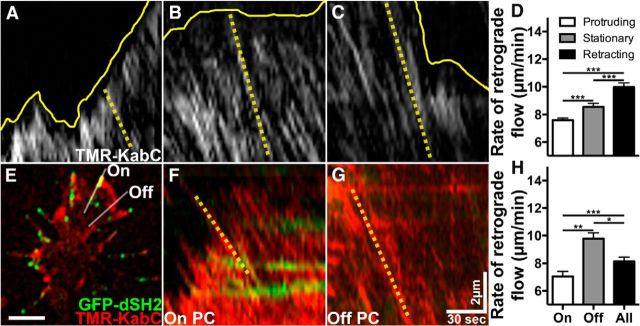
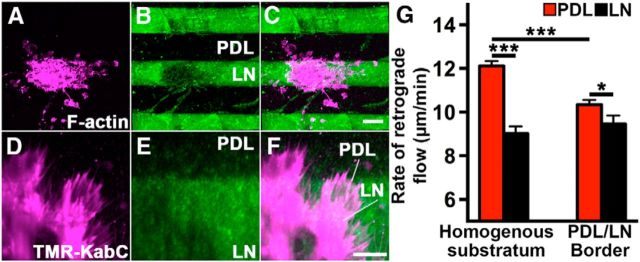
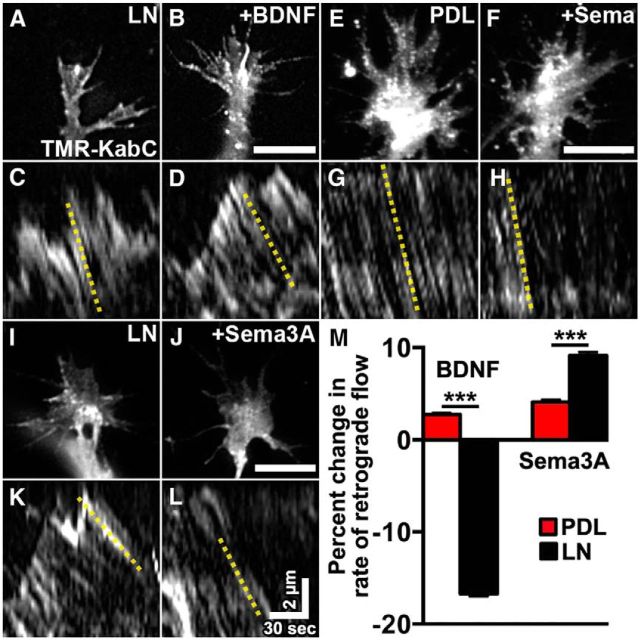
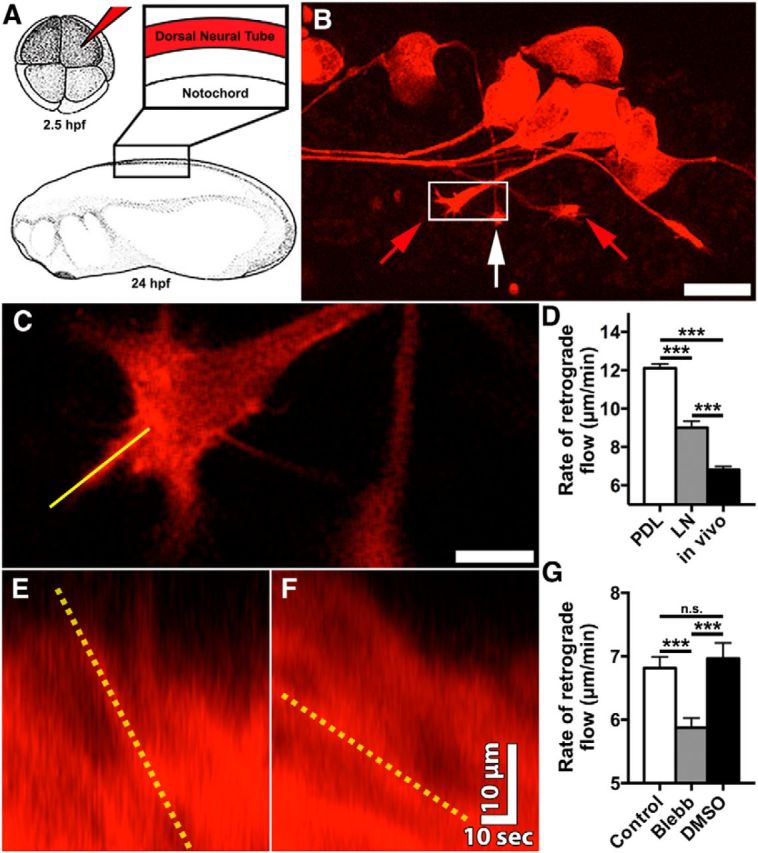
Growth cones interact with the extracellular matrix (ECM) through integrin receptors at adhesion sites termed point contacts. Point contact adhesions link ECM proteins to the actin cytoskeleton through numerous adaptor and signaling proteins. One presumed function of growth cone point contacts is to restrain or "clutch" myosin-II-based filamentous actin (F-actin) retrograde flow (RF) to promote leading edge membrane protrusion. In motile non-neuronal cells, myosin-II binds and exerts force upon actin filaments at the leading edge, where clutching forces occur. However, in growth cones, it is unclear whether similar F-actin-clutching forces affect axon outgrowth and guidance. Here, we show in Xenopus spinal neurons that RF is reduced in rapidly migrating growth cones on laminin (LN) compared with non-integrin-binding poly-d-lysine (PDL). Moreover, acute stimulation with LN accelerates axon outgrowth over a time course that correlates with point contact formation and reduced RF. These results suggest that RF is restricted by the assembly of point contacts, which we show occurs locally by two-channel imaging of RF and paxillin. Further, using micropatterns of PDL and LN, we demonstrate that individual growth cones have differential RF rates while interacting with two distinct substrata. Opposing effects on RF rates were also observed in growth cones treated with chemoattractive and chemorepulsive axon guidance cues that influence point contact adhesions. Finally, we show that RF is significantly attenuated in vivo, suggesting that it is restrained by molecular clutching forces within the spinal cord. Together, our results suggest that local clutching of RF can control axon guidance on ECM proteins downstream of axon guidance cues.

Significance statement: Here, we correlate point contact adhesions directly with clutching of filamentous actin retrograde flow (RF), which our findings strongly suggest guides developing axons. Acute assembly of new point contact adhesions is temporally and spatially linked to attenuation of RF at sites of forward membrane protrusion. Importantly, clutching of RF is modulated by extracellular matrix (ECM) proteins and soluble axon guidance cues, suggesting that it may regulate axon guidance in vivo. Consistent with this notion, we found that RF rates of spinal neuron growth cones were slower in vivo than what was observed in vitro. Together, our study provides the best evidence that growth cone-ECM adhesions clutch RF locally to guide axons in vivo.

Keywords: actin retrograde flow; axon guidance; growth cone; kabiramide C; molecular clutch; point contact adhesion.


Figures

Figure 1.
Figure 1.
The rate of axon outgrowth is inversely proportional to actin retrograde flow (RF) rates. AD, Actin RF in motile growth cones was visualized by TIRF microscopy using TMR-KabC, a barbed-end binding actin probe. Kymographs were generated from 2 min time-lapse sequences of TMR-KabC-labeled growth cones cultured on indicated substrata. Dashed yellow lines indicate example lines used to calculate flow rates. E, The rate of RF (left axis) and axon outgrowth (right axis) is inversely related for spinal neurons plated on different substrata: PDL (n = 16 growth cones, 68 axons), 10 μg/ml LN (n = 15 growth cones, 95 axons), PDL plus LN (n = 16 growth cones, 185 axons), 10 μg/ml FN (n = 16 growth cones, 70 axons), and 5 μg/ml TN (n = 8 growth cones, 37 axons). F, Rate of RF (left axis) and axon outgrowth (right axis) axis is inversely related for neurons plated on increasing concentrations of LN: 1 μg/ml (n = 11 growth cones, 80 axons), 5 μg/ml (n = 9 growth cones, 101 axons), 10 μg/ml (n = 10 growth cones, 63 axons), and 25 μg/ml (n = 12 growth cones, 249 axons). G, 2D image of a GFP-actin-expressing growth cone on PDL with kymograph sample line through leading edge (red line). Scale bar, 5 μm. HI, Kymographs were created from growth cones on PDL (H) and 10 μg/ml LN (I). J, Growth cones labeled with TMR-KabC and GFP-actin exhibited significantly lower RF rates on LN (n = 17 growth cones) relative to PDL (n = 20 growth cones). K, Coefficient of variation (SD/mean) of TMR-KabC RF is significantly greater for growth cones plated on 10 μg/ml LN (n = 137) versus PDL (n = 105). L, Kymographs generated from 2 min time-lapse sequences of TMR-KabC-labeled growth cones captured at the indicated times before and after 50 μm blebbistatin treatment. M, Rate of RF after blebbistatin treatment was significantly attenuated on PDL (n = 9 growth cones) and LN (n = 8 growth cones) (***p < 0.001), but the percentage reduction (data not shown) was more significantly reduced in growth cones on PDL (p < 0.001). ***p < 0.001; *p < 0.05.
Figure 2.
Figure 2.
Acute LN stimulation accelerates axon outgrowth over a time course that correlates with point contact formation and reduced retrograde flow. AA‴, Confocal images of a growth cone expressing PXN-GFP on PDL before and at indicated times after addition of 25 μg/ml LN. Within 10 min of LN addition, many point contact adhesions form (red arrowheads). Scale bar, 5 μm. B, Low-magnification phase contrast images showing that most axons accelerate (color-matched arrowheads) after 15 min of treatment with 25 μg/ml LN. Scale bar, 50 μm. C, Kymographs generated from 2 min time-lapse sequences of TMR-KabC-labeled growth cones captured at indicated times before and after LN addition. Dashed yellow lines indicated the calculated example flow rates. D, Average rate of axon outgrowth (n = 56) versus retrograde flow (n = 10 growth cones) at times before and after LN stimulation shows an inverse relationship. ***p < 0.001; **p < 0.01; *p < 0.05.
Figure 3.
Figure 3.
Point contact formation is required for LN induced axon outgrowth. A, A′, TIRF images of PXN-GFP expressing growth cone on PDL before (A) and 15 min after addition of LN (A′). B, Mean intensity of fluorescent LN on PDL-coated glass coverslips treated for 15 min with 25 μg/ml LN alone, 2 μg/ml heparin alone, and LN plus heparin. C, Axon outgrowth on PDL (n = 80) is stimulated by 15 min treatment with LN (n = 52), but is strongly inhibited by soluble LN (LN plus heparin, n = 25). D, D′, TIRF images of PXN-GFP expressing growth cone on PDL before (D) and 15 min after (D′) the addition of LN plus heparin. E, F, Kymographs generated from 2 min time-lapse sequences of TMR-KabC-labeled growth cones on PDL before (E, F) and after stimulation with LN (E′) and LN plus heparin (F′). Dashed yellow lines indicate example lines used to calculate flow rates. G, Average rates of TMR-KabC retrograde flow (RF) in growth cones plated on PDL before and 15 min after indicated stimulations. Adsorbed LN significantly slows RF, whereas soluble LN significantly accelerates RF (n = 9 growth cones). Scale bar, 5 μm. ***p < 0.001; **p < 0.01; *p < 0.05.
Figure 4.
Figure 4.
F-actin retrograde flow rates correlate with leading edge protrusion/retraction and is reduced at adhesion sites. AC, Representative kymographs generated from regions of protruding (A), stationary (B), and retracting (C) leading edge membrane. Dashed yellow lines indicated calculated example flow rates. Yellow line indicates growth cone leading edge. D, Rate of retrograde flow (RF) is significantly slower in protruding relative to stationary and retracting membranes (n = 15 growth cones). E, 2D TIRF image of a growth cone expressing PXN-GFP (green) and labeled with TMR-KabC (red). Note the strong TMR-KabC labeling at the leading edge where F-actin barbed-ends are concentrated. F, G, Kymographs generated from 2 min time-lapse sequences of TMR-KabC and PXN-GFP double-labeled growth cones using sampling lines over adhesions (F) and off adhesions (G). Horizontal green lines in F represent stable PXN-containing adhesions. H, Average RF rates over adhesions (n = 38) are significantly slower than off adhesions (n = 25) and compared with randomly sampled (n = 63) RF rates. Scale bar, 5 μm. ***p < 0.001; **p < 0.01; *p < 0.05.
Figure 5.
Figure 5.
F-actin retrograde flow is locally regulated within growth cones at PDL/LN substrata borders. AC, Low-magnification images of Xenopus spinal cord explants labeled for F-actin using Alexa Fluor 546–phalloidin (A) cultured on a patterned substratum of alternating lanes of PDL and LN (B). Borders were visualized using fluorescent (HiLyte 488) LN (green). Pseudocolored image merge (C) shows strong preference for LN. Scale bar, 50 μm. D, E, High-magnification TIRF image of a growth cone labeled with TMR-KabC (D) spanning a PDL/LN border (E). LN was-labeled with succinimidyl ester 647 (SE-647). F, Merged image of TMR-KabC-labeled growth cone (magenta) spanning the border between LN (green) and PDL (unlabeled) with representative lines used to generate kymographs. G, Average rates of retrograde flow (RF) in growth cones spanning a PDL/LN border are significantly faster over PDL compared with LN (n = 27 growth cones). However, differences between LN (n = 15 growth cones) and PDL (n = 10 growth cones) are more dramatic on homogenous substrata (note that RF rates on homogenous substrata are data duplicated from Fig. 1 for comparison). Scale bar, 5 μm. ***p < 0.001; *p < 0.05.
Figure 6.
Figure 6.
Soluble axon guidance cues modulate the rates of actin retrograde flow (RF). A, B, 2D TIRF images of a TMR-KabC-labeled growth cone on LN before (A) and 15 min after (B) BDNF treatment. Note that this growth cone expands in response to BDNF. C, D, Kymographs generated from 2 min time-lapse sequences of TMR-KabC-labeled growth cones captured before (C) and after (D) BDNF treatment. Dashed yellow lines indicated calculated example flow rates. E, F, 2D TIRF images of a TMR-KabC-labeled growth cone on PDL before (E) and 15 min after (F) Sema3A treatment. Note that this growth cone retracts slightly in response to Sema3A treatment. G, H, Kymographs generated from 2 min time-lapse sequences of TMR-KabC-labeled growth cones captured before (G) and after (H) Sema3A treatment. I, J, 2D TIRF images of a TMR-KabC-labeled growth cone on LN before (I) and 15 min after (J) Sema3A treatment. Note that this growth cone retracts slightly in response to Sema3A treatment. K, L, Kymographs generated from 2 min time-lapse sequences of TMR-KabC-labeled growth cones captured before (K) and after (L) Sema3A treatment. M, BDNF has little effect on the rate of RF of growth cones on PDL (n = 5 protruding growth cones), but RF significantly slows in growth cones on LN (n = 16 protruding growth cones). Sema3A accelerates RF of growth cones on LN (n = 11 growth cones) more significantly compared with growth cones on PDL (n = 11 growth cones). Scale bar, 5 μm. ***p < 0.001.
Figure 7.
Figure 7.
Axonal growth cones exhibit slow actin retrograde flow (RF) in vivo. A, Schematic illustrating blastomere injection of DNA plasmid encoding Td-Tomato tractin targeted to the dorsal spinal cord. Embryos were allowed to develop to 24 h postfertilization (hpf) before exposing spinal cord for live imaging. B, Low-magnification and contrast stretched confocal z-series projection showing F-actin-labeled Rohon–Beard neuron (red arrow) and commissural interneuron (white arrow). An ascending RB axon is tipped by a growth cone (box). Scale bar, 30 μm. C, High-magnification image from time series used to generate kymographs (yellow line) of growth cone from boxed region in B. Scale bar, 5 μm. D, Rate of RF in vivo (n = 19 growth cones) is significantly slower than RF rates observed in cultured neurons on PDL and 10 μg/ml LN. E, F, Kymographs generated from 2 min time-lapse sequences of a tractin-labeled growth cone before (E) and after (F) inhibition of myosin II with 50 μm blebbistatin. Dashed yellow lines indicated example flow lines used to calculate rates. G, ztate of RF after blebbistatin treatment is significantly reduced relative to pretreatment and DMSO control media. Scale bar, 10 μm. (***p < 0.001).
Model 1.
Model 1.
Regulation of protrusion through modulation of integrin-dependent F-actin clutching by axon guidance cues. Actin filaments populating the leading edge of growth cones undergo constant retrograde flow (RF) due to proximal myosin-II mediated contractile forces (Fcontraction) and distal actin polymerization, which pushes against the plasma membrane to propel filaments rearward (Fpolymerization). A, In the absence of integrin activation and clustering, the molecular clutch is disengaged and Fcontraction and Fpolymerization drive rapid actin RF. However, even under low clutching conditions, leading edge actin polymerization can at times exceed RF, resulting in modest forward protrusion (Fprotrusion) and some forward translocation of the growth cone. B, In the presence of extracellular matrix (ECM) proteins, integrin receptors are activated and cluster and recruit adhesome-related adaptor and signaling proteins to form point contact adhesions, which link to actin filaments. Point contact adhesions form a slip clutch with actin filaments (Fadhesion), which restricts RF and generates traction forces (Ftraction) on the ECM. Integrin activation also increases myosin-II activity and actin polymerization, which should increase actin RF. However, faster RF is overcome by point-contact-mediated clutching, which promotes forward growth cone translocation. C, BDNF increases point contact formation and turnover (Myers and Gómez, 2011) and promotes actin polymerization, as well as myosin-II activation (Gehler et al., 2004). However, more point contact adhesions that are rapidly turning over further clutch RF to increase forward protrusion and accelerate axon outgrowth. D, Sema3A, a repulsive axon guidance cue, promotes the disassembly of point contacts (Woo and Gómez, 2006), which disrupts F-actin clutching to minimize Fadhesion and Ftraction. In addition, Sema3A activates RhoA and ROCK, resulting in phosphorylation of myosin-II at Ser19, to increase Fcontraction (Gallo, 2006). Loss of point contact clutching and increased Fcontraction leads to strong activation of RF and subsequent axon stalling and retraction.

Similar articles

Cited by

References

    1. Antar LN, Li C, Zhang H, Carroll RC, Bassell GJ. Local functions for FMRP in axon growth cone motility and activity-dependent regulation of filopodia and spine synapses. Mol Cell Neurosci. 2006;32:37–48. doi: 10.1016/j.mcn.2006.02.001. - DOI - PubMed
    1. Bamburg JR. Proteins of the ADF/cofilin family: essential regulators of actin dynamics. Annu Rev Cell Dev Biol. 1999;15:185–230. doi: 10.1146/annurev.cellbio.15.1.185. - DOI - PubMed
    1. Bard L, Boscher C, Lambert M, Mège RM, Choquet D, Thoumine O. A molecular clutch between the actin flow and N-cadherin adhesions drives growth cone migration. J Neurosci. 2008;28:5879–5890. doi: 10.1523/JNEUROSCI.5331-07.2008. - DOI - PMC - PubMed
    1. Bechara A, Nawabi H, Moret F, Yaron A, Weaver E, Bozon M, Abouzid K, Guan JL, Tessier-Lavigne M, Lemmon V, Castellani V. FAK-MAPK-dependent adhesion disassembly downstream of L1 contributes to semaphorin3A-induced collapse. EMBO J. 2008;27:1549–1562. doi: 10.1038/emboj.2008.86. - DOI - PMC - PubMed
    1. Beck K, Hunter I, Engel J. Structure and function of laminin: anatomy of a multidomain glycoprotein. FASEB J. 1990;4:148–160. - PubMed

Publication types

LinkOut - more resources