. 2016 Mar;11(3):499-524.
doi: 10.1038/nprot.2016.015. Epub 2016 Feb 18.

Using single nuclei for RNA-seq to capture the transcriptome of postmortem neurons

Affiliations

Using single nuclei for RNA-seq to capture the transcriptome of postmortem neurons

Suguna Rani Krishnaswami et al. Nat Protoc. 2016 Mar.

Abstract

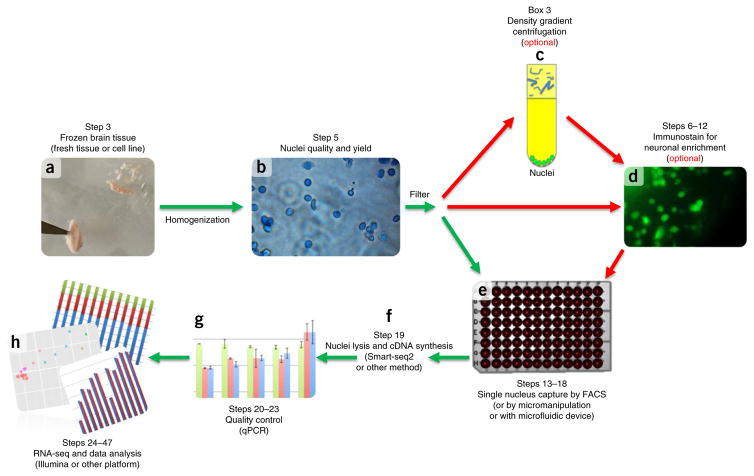
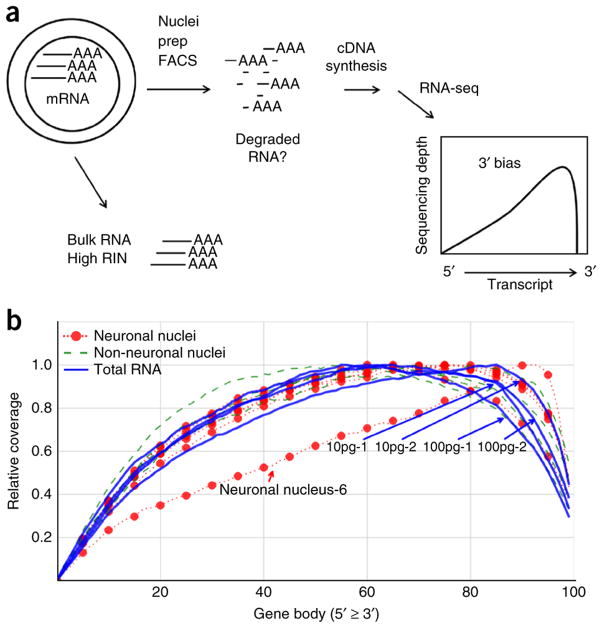
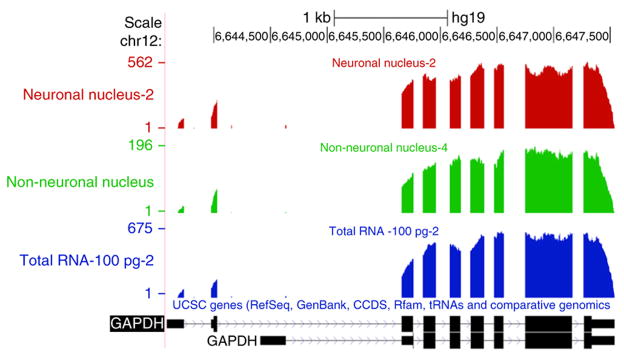
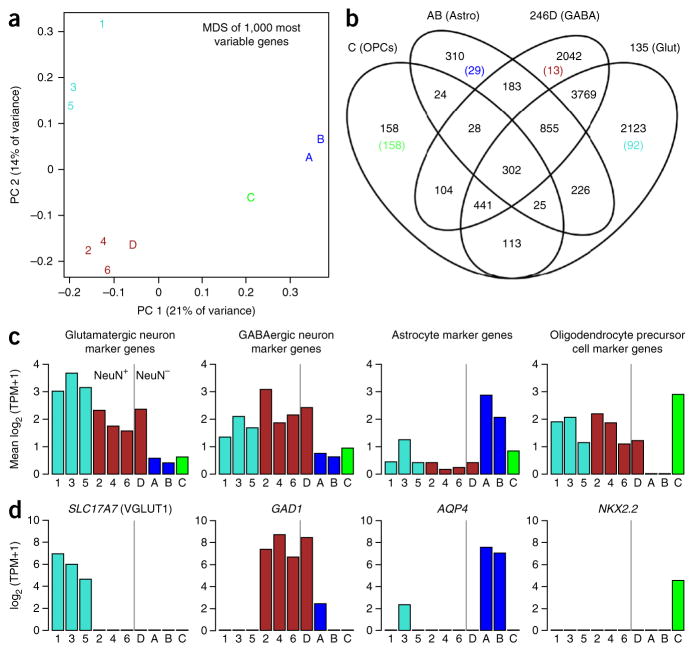
A protocol is described for sequencing the transcriptome of a cell nucleus. Nuclei are isolated from specimens and sorted by FACS, cDNA libraries are constructed and RNA-seq is performed, followed by data analysis. Some steps follow published methods (Smart-seq2 for cDNA synthesis and Nextera XT barcoded library preparation) and are not described in detail here. Previous single-cell approaches for RNA-seq from tissues include cell dissociation using protease treatment at 30 °C, which is known to alter the transcriptome. We isolate nuclei at 4 °C from tissue homogenates, which cause minimal damage. Nuclear transcriptomes can be obtained from postmortem human brain tissue stored at -80 °C, making brain archives accessible for RNA-seq from individual neurons. The method also allows investigation of biological features unique to nuclei, such as enrichment of certain transcripts and precursors of some noncoding RNAs. By following this procedure, it takes about 4 d to construct cDNA libraries that are ready for sequencing.


Conflict of interest statement

COMPETING FINANCIAL INTERESTS The authors declare no competing financial interests.

Figures

Figure 1
Figure 1
Single nuclei isolation experimental workflow. Dounce homogenization in lysis buffer is used to disrupt cellular membranes for fresh or frozen tissue (a). Nuclei quality and yield is determined by hemocytometer count (b). (ce) Nuclei and cellular debris are filtered for optional purification and immunostaining steps (density gradient centrifugation (c) or staining for neuronal enrichment (d)), or for FACS sorting (e). (f,g) Subsequently, lysis of the nuclei and cDNA synthesis is carried out using either published methods or commercial kits (SMARTer, Clontech) (f), and it is quality-controlled for size distribution using a Bioanalyzer (Agilent) and the presence of several transcripts by qPCR (g). (h) Sequencing and data analysis confirm single nucleus transcriptome capture. Step numbers indicate the corresponding step numbers in the PROCEDURE section. Graphs in g and h are for illustrative purposes only.
Figure 2
Figure 2
Quality control of nuclei isolation. (a,b) Nuclei were obtained from the human prefrontal cortex and extracted via Dounce homogenization; they were stained with 0.2% (vol/vol) trypan blue, counted on a hemocytometer (a), placed on a slide and microscopically examined for morphological quality and yield (b). (c,d) By using epifluorescence microscopy, nuclei were stained with DNA intercalating dye Hoechst 33342 (10 ng μl−1) (c), with blue fluorescent nuclei images overlaid with the bright-field image to identify intact nuclei (d). (e) After cell strainer filtration, nuclei were stained with NeuN-Alexa Fluor 488–conjugated antibody (0.01 mg ml−1) to identify intact neuronal nuclei. (f) The fluorescent image was overlaid with the bright-field image to further distinguish nuclei derived from neuronal versus non-neuronal cells. (g,h) By using FACS, cells were sorted onto a microscope slide and imaged for NeuN fluorescence (g) and overlaid in bright field (h) to confirm FACS sorting conditions.
Figure 3
Figure 3
FACS of single nuclei. Nuclei triple-stained with NeuN-Alexa Fluor 488–conjugated antibody (0.01 mg ml−1; EMD Millipore), Hoechst 33342 (10 ng ml−1) and PI (1 μM) were filtered through a 35-μm cell strainer and loaded onto a custom FACS ARIA II flow sorter (Becton Dickinson) equipped with a forward scatter photomultiplier tube. (ad) Doublet discrimination gating was used to isolate single nuclei (ac) and intact nuclei determined by subgating on Hoechst 33342 (d). (a) Particles smaller than nuclei (black dots) are eliminated with an area plot of forward scatter (FSC-PMT-A) versus side scatter (SSC-A), with gating for nuclei-sized particles inside the gate (box). (b,c) Plots of height versus width in the side scatter and forward scatter channels, respectively, are used for doublet discrimination with gating to exclude aggregates of two or more nuclei. (e,f) Subsequent plots and gating discern NeuN-Alexa Fluor488–conjugated antibody (e) and PI-stained nuclei (f). The resultant hierarchical color key ensures that only single nuclei that are positive or negative for staining with the NeuN antibody (NeuN+ and NeuN) are passed through each gating condition. (g) Yellow fluorescent 10- to 14-μm polystyrene microspheres (Spherotech) were used to determine the accuracy and precision of microplate targeting, and they were confirmed by microscopic imaging of single spheres in a 384-well microplate. (h,i) Subsequent FACS gating of labeled nuclei (arrows) was confirmed via imaging on a microscope slide (h), as well as within individual wells of a 384-well microplate (i).
Figure 4
Figure 4
qPCR and Bioanalyzer quality control analysis of total mRNA, single-nucleus cDNA synthesis and a single-nucleus NexteraXT RNA-seq library. Total RNA from ~2–3 mm3 section of total human prefrontal cortex tissue was purified using a Qiagen RNeasy mini kit, quantified by Nanodrop spectrophotometry and diluted to 5 ng μl−1. (a) The mRNA quality was determined using RIN values by loading 1 μl onto an Agilent RNA pico chip and run on the Agilent Bioanalyzer. (b,c) Representative example using a single nucleus for Smart-seq2 cDNA synthesis followed by PCR amplification (b; 1 μl) and a Nextera XT sequencing library (c; 1 μl) were also analyzed. (b) After AMPure bead purification of the cDNA, a size range of ~150 bp to 7 kbp is expected, with the majority of fragments in the 1–3 kb range. After AMPure bead purification of each Nextera XT library, a size range of ~200 bp to 1 kbp is expected. The hash marks on the x axis are 35, 50, 100, 150, 200, 300, 400, 500, 600, 700, 1,000, 2,000, 3,000, 7,000 and 10,000, with lane marker peaks seen at 35 and 10,380 bp. Separately, Smart-seq2 synthesis of cDNA and PCR was performed on single nuclei (n = 24), and on pools of 8 nuclei (n = 4), 24 nuclei (n = 4), 48 nuclei (n = 2), 96 nuclei (n = 2) and duplicates of 100 pg, 10 pg and 1 pg total RNA from the prefrontal cortex, to serve as technical replicates to reveal artifactual noise level due to technical causes such as variation in pipetting and temperature differences between PCR block wells. NTCs are used to detect nonspecific cDNA amplification derived from contaminants in the reaction components or introduced during handling. (d) Quality control qPCR of cDNA was performed in 10-μl reactions using ABI TaqMan gene expression assays for GAPDH, ACTB and ERCC-00077. qPCR cycle threshold (Ct) values were plotted for comparison with single nuclei Cts, typically ranging between 15 and 25. Note that Cts increase by about 3 cycles per tenfold increase in input RNA template, as expected from the doubling rate of DNA in PCR.
Figure 5
Figure 5
Overall characteristics of mapping and expression. The sequencing reads for ten individual nuclei were split into three groups: ‘ERCC’, ‘Genome’ and ‘Unmapped’ on the basis of their mapping using the RSEM software. On average, 417,964, 183,278 and 941,644 reads were mapped to the genome for each neuronal nucleus, non-neuronal nucleus and total RNA sample, respectively. The numbers in the parenthesis indicate the number of genes with a TPM value >0 for the sample. It is clear that our sequencing did not reach saturation for some samples, as there is a high correlation between the number of reads mapped to the genome and the number of genes expressed. The high number of genes detected for Total RNA also reflects the pooling of RNA from multiple cells, which captures all genes expressed in the population.
Figure 6
Figure 6
Behavior of ERCC spike-in controls, sensitivity and detection limit estimation. The number of ERCC spike-in transcript molecules, diluted 1.1 × 10⁷ fold from the original stock in the final RT-mix, are plotted against the average TPM expression values across all 14 samples using log2 scale for both axes. The 1.1 × 10⁷-fold dilution (PROCEDURE Step 13 and INTRODUCTION) is greater than that recommended by the ERCC spike-in manufacturer, who had optimized it for use with nanogram quantities of RNA in microarray studies. The low levels of RNA in a single nucleus necessitate the greater dilution in order to avoid high percentages of sequencing reads devoted to ERCC spike-ins. However, some of the lower-copy transcript species present in the ERCC spike-in stock are consequently diluted to <1 copy per Smart-seq2 reaction tube. ERCC spike-in transcripts with expression in at least one of the 14 nuclei were considered (ERCC n = 67 of 92) with regression equation y = 0.9817x + 3.1913 and R2 = 0.916. The RNA released from the lysed nuclei plus the added ERCC spike-in controls were amplified to 21 PCR cycles. The detection threshold for a single ERCC spike-in transcript molecule is shown to be approximately equivalent to 9 TPM RNA expression units (1 molecule = 9 TPM, as indicated by the intersection of the dashed lines).
Figure 7
Figure 7
Biological variation and technical noise stratified by relative expression of genes. The genes that are expressed in bulk Total RNA-100pg-2 (see Supplementary Table 1) were stratified equally into low, mid and high expressers based on their TPM values (4,292 genes per category). Low genes had TPM values between 0.01 and 7.44, mid genes had TPM values between 7.45 and 25.97 and high genes had TPM values >25.98 (a). For the 4,292 genes of each category, the graph shows the fraction found in each sample. By definition, Total RNA-100pg-2 has 100%, 100% and 100% representation for low, mid and high (b). Each gene that is expressed in the sample is labeled by its expression in the bulk RNA sample. The fraction of low-, mid- and high-expressed genes, as well as novel genes that were not found in the bulk control, was quantified.
Figure 8
Figure 8
The use of 3′ bias as a quality control assay for cDNA. (a) Total (bulk) RNA derived from tissue is confirmed to have a high RIN score before isolation of nuclei. Partial degradation of the RNA might occur during the preparation of nuclei by Dounce homogenization (nuclei prep) or FACS of the individual nuclei. If the mRNA is degraded by hydrolysis, shearing or RNases, truncated mRNA species could be created, and those containing the polyA sequence at the 3′ end of the transcripts might produce cDNA. This would generate greater RNA-seq coverage of the 3′ end of transcripts (3′-bias) compared with the high-quality bulk RNA. Gene body coverage across 4,292 highly expressed genes was calculated by RseqC. The relative coverage is defined as coverage at a base / maximum coverage across the gene. (b) The total RNA samples are indicated (two replicates of 10 pg and 100 pg RNA each; Supplementary Table 1). As these total RNA controls are all from a single RNA purification from bulk tissue, they would have identical coverage profiles in the ideal case. The minor differences indicate the level of technical variation accumulated from all of the reaction steps. The single nuclei have very similar 3′ bias to the total RNA controls, demonstrating that little damage was done to the RNA during the processing of nuclei. Neuronal nucleus 6 (Supplementary Table 1) is indicated, and it diverges from normal behavior. It may be an example of partially degraded mRNA being obtained from the nucleus and the resulting truncated cDNA; however, we believe that it is actually attributable to its low number of reads mapping to the genome, which must be taken into consideration for this analysis. We have recently confirmed that partially degraded total mRNA, which is formed experimentally by heating in the presence of sodium acetate, results in a commensurate increase in 3′ bias, demonstrating that this analysis can quantitatively detect RNA damage (M.N. and R.S.L., unpublished data).
Figure 9
Figure 9
Read depth across the GAPDH gene. University of California at Santa Cruz (UCSC) genome browser snapshot of custom bedGraph tracks detailing the coverage across the GAPDH gene for neuronal nucleus 2, non-neuronal nucleus 4 and total RNA 100pg-2 samples (Supplementary Table 1). The lack of coverage across introns indicates that most of the GAPDH transcripts sequenced were spliced transcripts for all three types of sample types. The position of exons is indicated by the black rectangles in the genomic map at the bottom.
Figure 10
Figure 10
Nuclei captured from several neuronal and glial cell types. Nuclei cluster into four discrete groups. (a) Multidimensional scaling (MDS) plot of 10 nuclei (Supplementary Table 1) based on the first two principal coordinates (PC, x and y axes). Labels 1–6 are the NeuN+ cells 1–6, and A–D correspond to NeuN– cells 1–4, and they are color-coded based on k-means clustering with n = 4. (b) Venn diagram showing the number of genes expressed in at least one cell in each group. The number of cells expressed in all cells of one cluster and no cells in any other cluster are shown in parentheses, and they are color-coded as in a. Cell clusters correspond to discrete cell types based on known marker genes. (c) Average expression of marker genes for glutamatergic neurons, GABAergic neurons, astrocytes and oligodendrocyte precursor cells is shown for each cell, and it is color-coded as in a. Cells to the right and left of the vertical bar are the NeuN+ and NeuN cells collected by FACS, respectively. (d) Canonical marker genes for glutamatergic neurons (SLC17A7), GABAergic neurons (GAD1), astrocytes (AQP4) and oligodendrocyte precursor cells (NKX2.2) are expressed as expected, based on cell type. Axes and colors for d are the same as those in c.

References

    1. Hashimshony T, Wagner F, Sher N, Yanai I. CEL-Seq: single-cell RNA-seq by multiplexed linear amplification. Cell Rep. 2012;2:666–673. - PubMed
    1. Kurimoto K, Yabuta Y, Ohinata Y, Saitou M. Global single-cell cDNA amplification to provide a template for representative high-density oligonucleotide microarray analysis. Nat Protoc. 2007;2:739–752. - PubMed
    1. Picelli S, et al. Full-length RNA-seq from single cells using Smart-seq2. Nat Protoc. 2014;9:171–181. - PubMed
    1. Ramskold D, et al. Full-length mRNA-seq from single-cell levels of RNA and individual circulating tumor cells. Nat Biotechnol. 2012;30:777–782. - PMC - PubMed
    1. Tang F, et al. RNA-seq analysis to capture the transcriptome landscape of a single cell. Nat Protoc. 2010;5:516–535. - PMC - PubMed

Publication types