

Bovine Host Genetic Variation Influences Rumen Microbial Methane Production with Best Selection Criterion for Low Methane Emitting and Efficiently Feed Converting Hosts Based on Metagenomic Gene Abundance
- PMID: 26891056
- PMCID: PMC4758630
- DOI: 10.1371/journal.pgen.1005846
Bovine Host Genetic Variation Influences Rumen Microbial Methane Production with Best Selection Criterion for Low Methane Emitting and Efficiently Feed Converting Hosts Based on Metagenomic Gene Abundance
Abstract
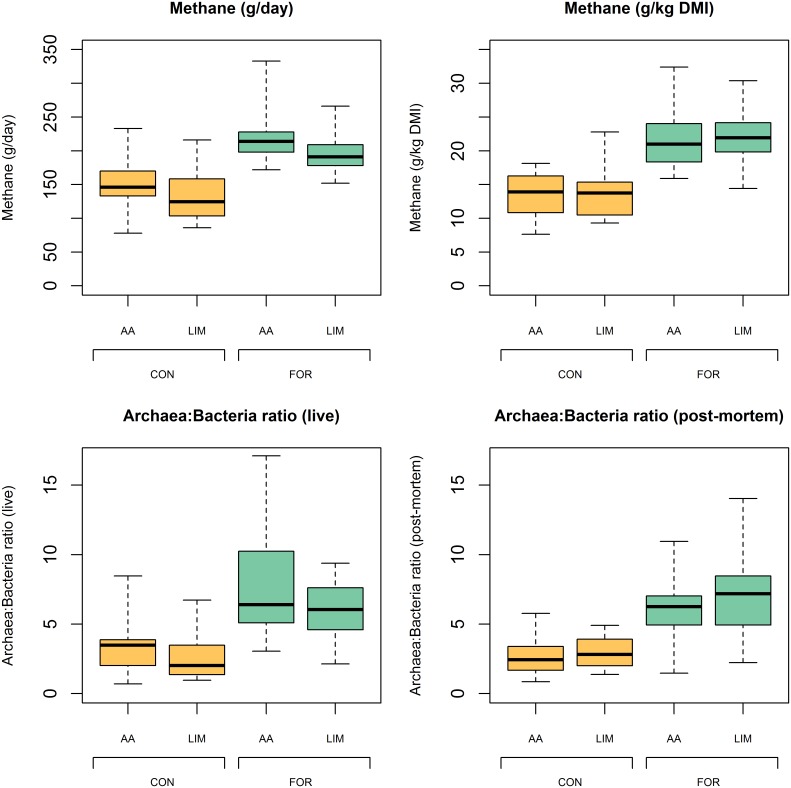
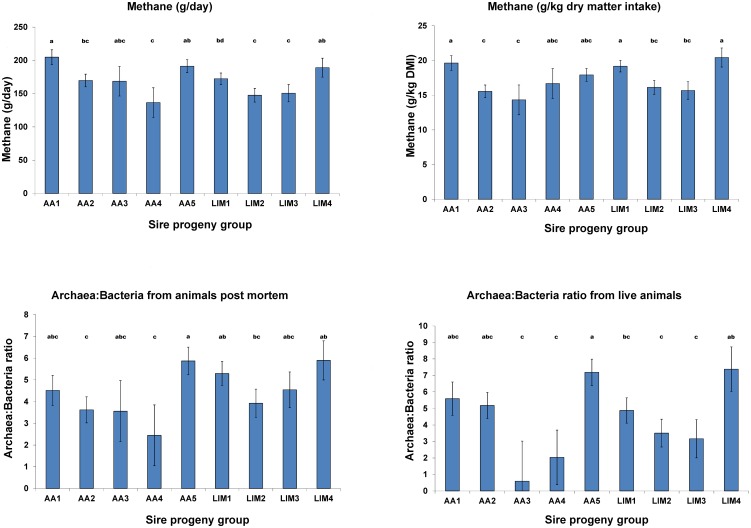
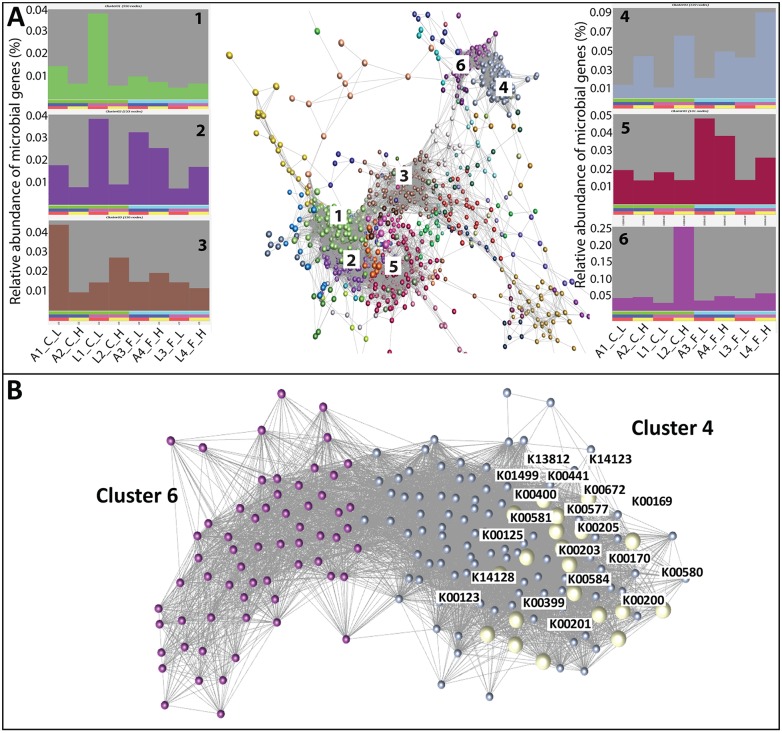
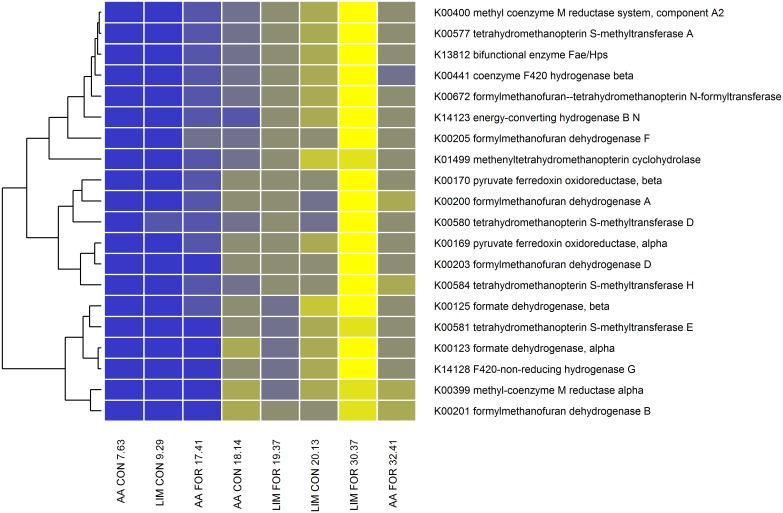
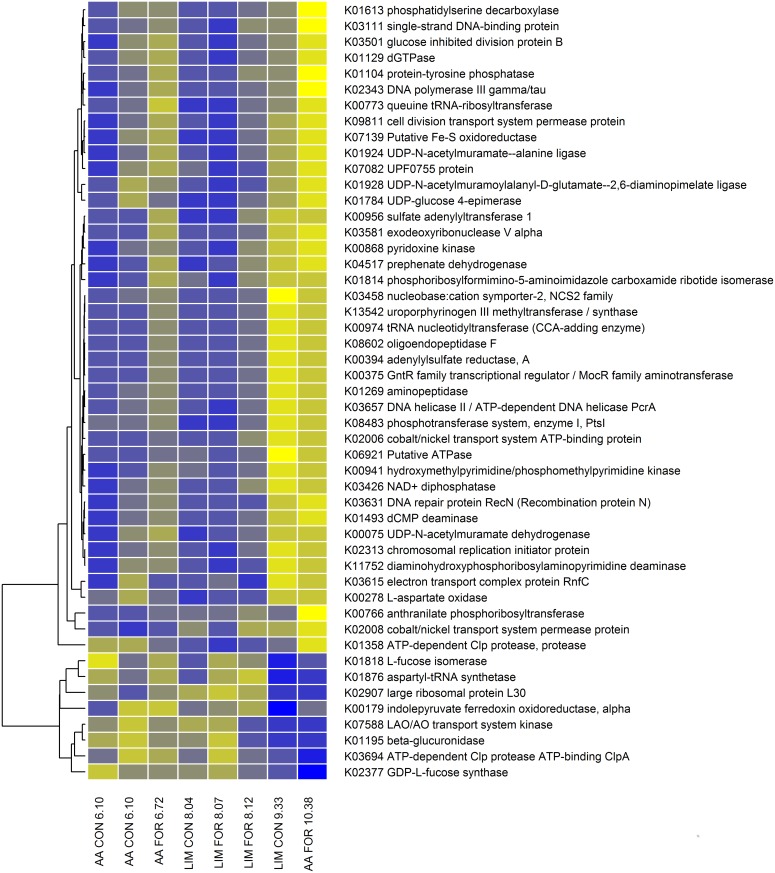
Methane produced by methanogenic archaea in ruminants contributes significantly to anthropogenic greenhouse gas emissions. The host genetic link controlling microbial methane production is unknown and appropriate genetic selection strategies are not developed. We used sire progeny group differences to estimate the host genetic influence on rumen microbial methane production in a factorial experiment consisting of crossbred breed types and diets. Rumen metagenomic profiling was undertaken to investigate links between microbial genes and methane emissions or feed conversion efficiency. Sire progeny groups differed significantly in their methane emissions measured in respiration chambers. Ranking of the sire progeny groups based on methane emissions or relative archaeal abundance was consistent overall and within diet, suggesting that archaeal abundance in ruminal digesta is under host genetic control and can be used to genetically select animals without measuring methane directly. In the metagenomic analysis of rumen contents, we identified 3970 microbial genes of which 20 and 49 genes were significantly associated with methane emissions and feed conversion efficiency respectively. These explained 81% and 86% of the respective variation and were clustered in distinct functional gene networks. Methanogenesis genes (e.g. mcrA and fmdB) were associated with methane emissions, whilst host-microbiome cross talk genes (e.g. TSTA3 and FucI) were associated with feed conversion efficiency. These results strengthen the idea that the host animal controls its own microbiota to a significant extent and open up the implementation of effective breeding strategies using rumen microbial gene abundance as a predictor for difficult-to-measure traits on a large number of hosts. Generally, the results provide a proof of principle to use the relative abundance of microbial genes in the gastrointestinal tract of different species to predict their influence on traits e.g. human metabolism, health and behaviour, as well as to understand the genetic link between host and microbiome.
Conflict of interest statement
The authors have declared that no competing interests exist.
Figures
References
-
- FAO. World Livestock 2011—Livestock in food security. FAO; Rome, Italy; 2011.
-
- IPCC. Climate Change 2014—Synthesis Report. Contribution of working groups I, II and III to the fifth assessment report of the Intergovernmental Panel on Climate Change. Core Writing Team, Pachauri RK, Meyer LA, editors. Geneva, Switzerland; 2014.
-
- Hristov AN, Oh J, Firkins JL, Dijkstra J, Kebreab E, Waghorn G, et al. SPECIAL TOPICS-Mitigation of methane and nitrous oxide emissions from animal operations: I. A review of enteric methane mitigation options. J Anim Sci. 2013;91: 5045–5069. - PubMed
-
- Johnson KA, Johnson DE. Methane emissions from cattle. J Anim Sci. 1995;73: 2483–2492. - PubMed
Publication types
MeSH terms
Substances
Grants and funding
- BBS/E/D/20211550/BB_/Biotechnology and Biological Sciences Research Council/United Kingdom
- BBS/E/D/20211553/BB_/Biotechnology and Biological Sciences Research Council/United Kingdom
- BB/J004243/1/BB_/Biotechnology and Biological Sciences Research Council/United Kingdom
- BBS/E/D/20211551/BB_/Biotechnology and Biological Sciences Research Council/United Kingdom
- BB/J004235/1/BB_/Biotechnology and Biological Sciences Research Council/United Kingdom
- G0900740/MRC_/Medical Research Council/United Kingdom
- BBS/E/D/05191132/BB_/Biotechnology and Biological Sciences Research Council/United Kingdom
- BB/I001107/1/BB_/Biotechnology and Biological Sciences Research Council/United Kingdom
- MR/K001744/1/MRC_/Medical Research Council/United Kingdom
- BBS/E/D/20211552/BB_/Biotechnology and Biological Sciences Research Council/United Kingdom
LinkOut - more resources
Full Text Sources
Other Literature Sources
