. 2016 Feb 18;11(2):e0148886.
doi: 10.1371/journal.pone.0148886. eCollection 2016.

Large-Scale Assessment of a Fully Automatic Co-Adaptive Motor Imagery-Based Brain Computer Interface

Affiliations

Large-Scale Assessment of a Fully Automatic Co-Adaptive Motor Imagery-Based Brain Computer Interface

Laura Acqualagna et al. PLoS One. .

Abstract

In the last years Brain Computer Interface (BCI) technology has benefited from the development of sophisticated machine leaning methods that let the user operate the BCI after a few trials of calibration. One remarkable example is the recent development of co-adaptive techniques that proved to extend the use of BCIs also to people not able to achieve successful control with the standard BCI procedure. Especially for BCIs based on the modulation of the Sensorimotor Rhythm (SMR) these improvements are essential, since a not negligible percentage of users is unable to operate SMR-BCIs efficiently. In this study we evaluated for the first time a fully automatic co-adaptive BCI system on a large scale. A pool of 168 participants naive to BCIs operated the co-adaptive SMR-BCI in one single session. Different psychological interventions were performed prior the BCI session in order to investigate how motor coordination training and relaxation could influence BCI performance. A neurophysiological indicator based on the Power Spectral Density (PSD) was extracted by the recording of few minutes of resting state brain activity and tested as predictor of BCI performances. Results show that high accuracies in operating the BCI could be reached by the majority of the participants before the end of the session. BCI performances could be significantly predicted by the neurophysiological indicator, consolidating the validity of the model previously developed. Anyway, we still found about 22% of users with performance significantly lower than the threshold of efficient BCI control at the end of the session. Being the inter-subject variability still the major problem of BCI technology, we pointed out crucial issues for those who did not achieve sufficient control. Finally, we propose valid developments to move a step forward to the applicability of the promising co-adaptive methods.


Conflict of interest statement

Competing Interests: The authors have declared that no competing interests exist.

Figures

Fig 1
Fig 1. Schematic flowchart of the online protocol.
The EEG processing and adaptation protocol during runs 1–3 with positive biased feedback are depicted in blue, in yellow the processing and adaptation during runs 4–5 with real feedback, in green the processing and adaptation during runs 6–7 also with real feedback. The adaptation applied in runs 1–3 and 4–5 uses supervised methods, the adaptation of runs 6–7 uses unsupervised methods. In magenta are depicted the phases of subject-specific features selection (e.g. frequency band, CSP filters, etc) and training of the classifier that happened two times, i.e. after runs 1–3 and after runs 4–5.
Fig 2
Fig 2. Overview of BCI performances sorted in ascendent order.
For each participant, the black crosses indicate the overall mean feedback accuracy and the colored stars the accuracies of the four feedback runs (4–7). The participants of Berlin are displayed in magenta and the ones of Würzburg in green. The accuracies of each participant are connected by colored lines that emphasize the variance of the accuracies between runs. The dotted gray lines represent the accuracy considered necessary for BCI control (70%) and the threshold for accuracy significantly higher than chance (54.69%).
Fig 3
Fig 3. Mean BCI feedback accuracies for each intervention group (Control, PMR, 2HAND) over runs 4–7 (left) and run-wise (right).
‘B’ refers to participants of Berlin and ‘W’ to participants of Würzburg. PMR W has significantly higher mean BCI performance compared to Control W (p<0.05), marked with a star in the bar plot.
Fig 4
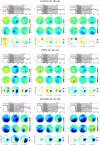
Fig 4. Grand average ERD/ERS for class combination. left-right and intervention groups in Berlin.
‘N’ is the number of participants of each group. From left to right: runs 1–3, runs 4–5, runs 6–7. The time plots in the first rows picture the evolution of the ERD/ERS for about 6000 ms at C3 (thick lines) and C4 (thin lines). At time 0 is the onset of the cue, at times 1000–4000 the display of the feedback. Magenta lines refer to left MI trials, green lines to right MI trials. The scalp plots underneath refer to the shaded areas of the time plots and show the distribution of the ERD/ERS. In the second rows, the scalp plots of the left MI trials, in the third rows the scalp plots of the right MI trials and in the fourth the scalp plots of the sign-r2.
Fig 5
Fig 5. Grand average ERD/ERS for class combination left-right and intervention groups in Würzburg.
‘N’ is the number of participants of each group. From left to right: runs 1–3, runs 4–5, runs 6–7. The time plots in the first rows picture the evolution of the ERD/ERS for about 6000 ms at C3 (thick lines) and C4 (thin lines). At time 0 is the onset of the cue, at times 1000–4000 the display of the feedback. Magenta lines refer to left MI trials, green lines to right MI trials. The scalp plots underneath refer to the shaded areas of the time plots and show the distribution of the ERD/ERS. In the second rows, the scalp plots of the left MI trials, in the third rows the scalp plots of the right MI trials and in the fourth the scalp plots of the sign-r2.
Fig 6
Fig 6. Predictor of BCI performance.
The predictor is calculated from 2.5 minutes of recording of the brain in resting state with eyes open and correlated with the mean feedback accuracy for each participant (blue dots). The back dashed line pictures the linear regression between the predictors and the accuracies (r = 0.53). The magenta dots are the values detected as outliers. After the exclusion of the outliers, a higher correlation of 0.66 is reached (magenta line).

References

    1. Wolpaw JR, Wolpaw EW, editors. Brain-computer interfaces: principles and practice. Oxford University press; 2012. ISBN-13: 978-0195388855.
    1. Dornhege G, del R Millán J, Hinterberger T, McFarland D, Müller KR, editors. Toward Brain-Computer Interfacing. Cambridge, MA: MIT Press; 2007.
    1. Birbaumer N. Breaking the silence: brain–computer interfaces (BCI) for communication and motor control. Psychophysiology. 2006;43(6):517–532. 10.1111/j.1469-8986.2006.00456.x - DOI - PubMed
    1. Nijboer F, Sellers EW, Mellinger J, Jordan MA, Matuz T, Furdea A, et al. A P300-based brain-computer interface for people with amyotrophic lateral sclerosis. Clin Neurophysiol. 2008;119:1909–1916. 10.1016/j.clinph.2008.03.034 - DOI - PMC - PubMed
    1. Kübler A, Nijboer F, Mellinger J, Vaughan TM, Pawelzik H, Schalk G, et al. Patients with ALS can use sensorimotor rhythms to operate a brain-computer interface. Neurology. 2005;64(10):1775–1777. 10.1212/01.WNL.0000158616.43002.6D - DOI - PubMed

Publication types

LinkOut - more resources