. 2016 Feb 18;12(2):e1005438.
doi: 10.1371/journal.ppat.1005438. eCollection 2016 Feb.

Transcriptome-Wide Analysis of Hepatitis B Virus-Mediated Changes to Normal Hepatocyte Gene Expression

Affiliations

Transcriptome-Wide Analysis of Hepatitis B Virus-Mediated Changes to Normal Hepatocyte Gene Expression

Jason Lamontagne et al. PLoS Pathog. .

Abstract

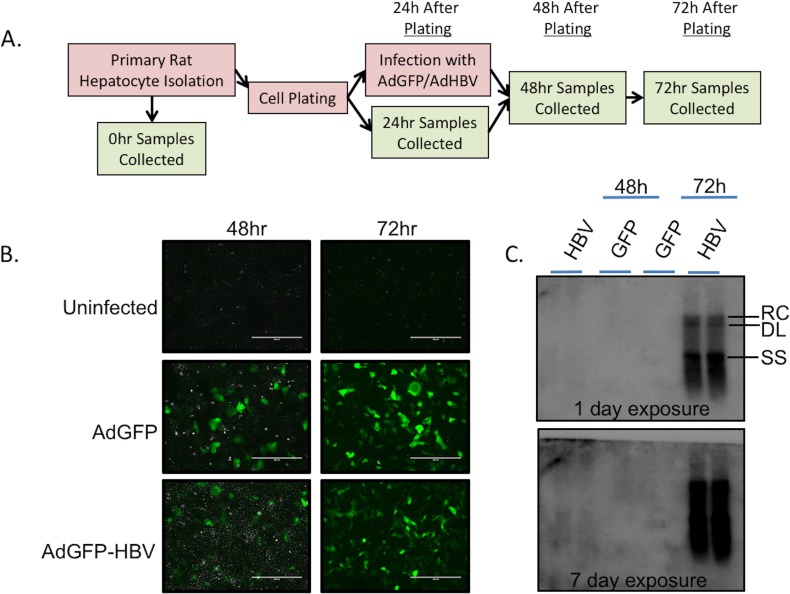
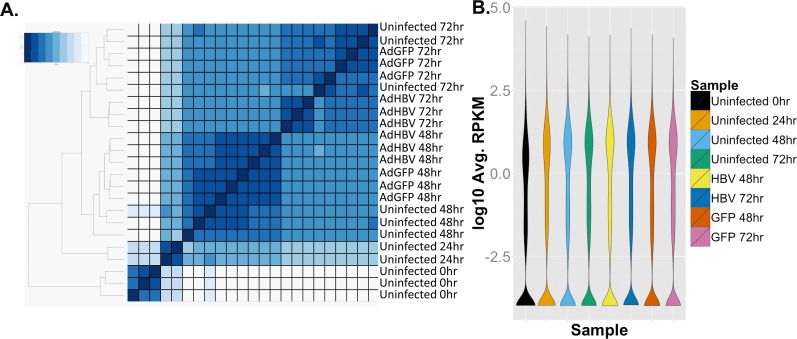
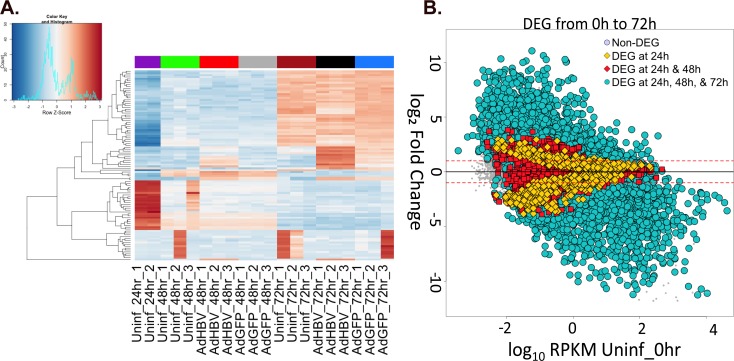
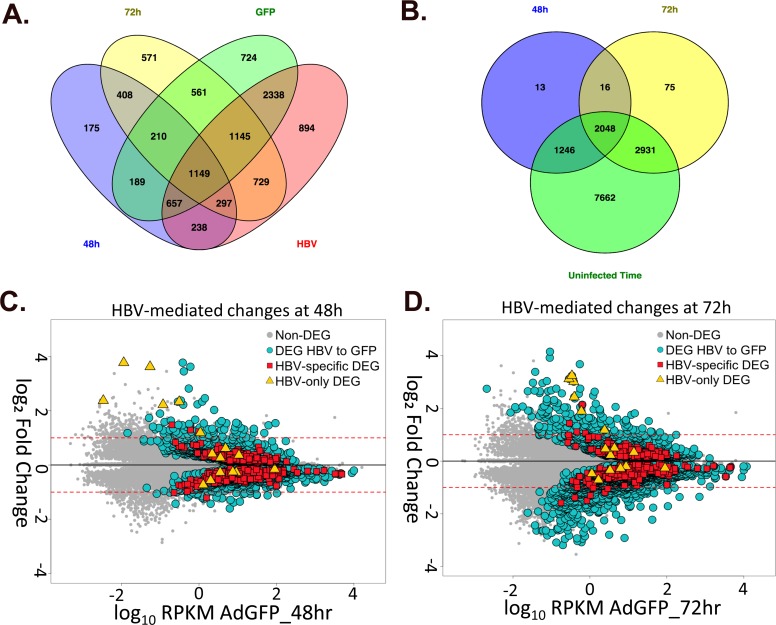
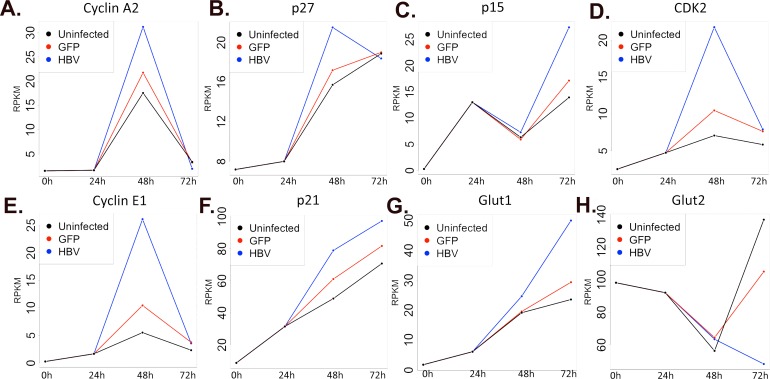
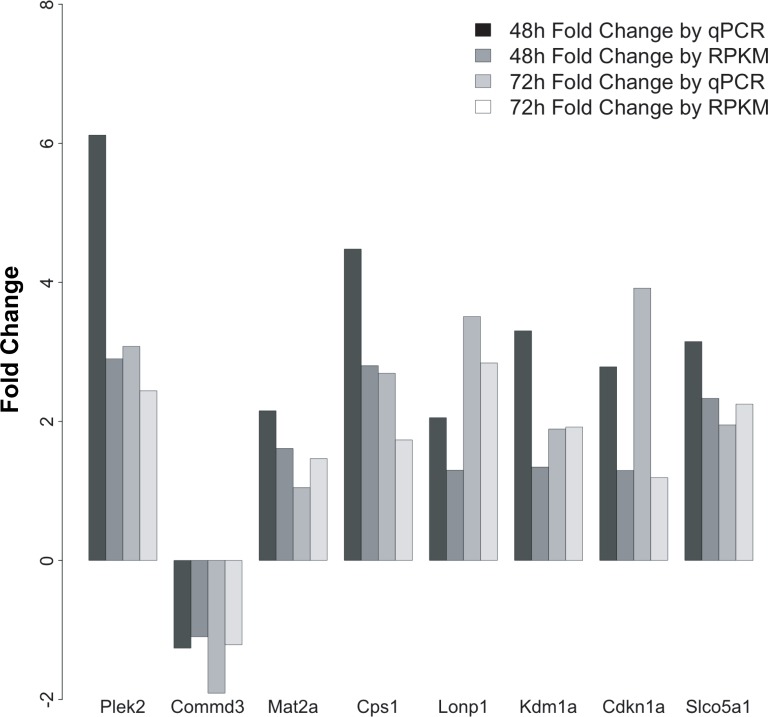
Globally, a chronic hepatitis B virus (HBV) infection remains the leading cause of primary liver cancer. The mechanisms leading to the development of HBV-associated liver cancer remain incompletely understood. In part, this is because studies have been limited by the lack of effective model systems that are both readily available and mimic the cellular environment of a normal hepatocyte. Additionally, many studies have focused on single, specific factors or pathways that may be affected by HBV, without addressing cell physiology as a whole. Here, we apply RNA-seq technology to investigate transcriptome-wide, HBV-mediated changes in gene expression to identify single factors and pathways as well as networks of genes and pathways that are affected in the context of HBV replication. Importantly, these studies were conducted in an ex vivo model of cultured primary hepatocytes, allowing for the transcriptomic characterization of this model system and an investigation of early HBV-mediated effects in a biologically relevant context. We analyzed differential gene expression within the context of time-mediated gene-expression changes and show that in the context of HBV replication a number of genes and cellular pathways are altered, including those associated with metabolism, cell cycle regulation, and lipid biosynthesis. Multiple analysis pipelines, as well as qRT-PCR and an independent, replicate RNA-seq analysis, were used to identify and confirm differentially expressed genes. HBV-mediated alterations to the transcriptome that we identified likely represent early changes to hepatocytes following an HBV infection, suggesting potential targets for early therapeutic intervention. Overall, these studies have produced a valuable resource that can be used to expand our understanding of the complex network of host-virus interactions and the impact of HBV-mediated changes to normal hepatocyte physiology on viral replication.


Conflict of interest statement

The authors have declared that no competing interests exist.

Figures

Fig 1
Fig 1. Confirmation of experimental system.
A. Experimental setup for primary dataset. B. PRHs were infected with either AdGFP or AdGFP-HBV, and infection efficiency was determined by monitoring GFP expression at 48hr and 72hr (24hr and 48hr post-infection). C. HBV replication was monitored by Southern blot analysis of HBV core particle-associated DNA. Blot was exposed for 1 day (upper panel) or 7 days (lower panel) to allow visualization of HBV replication at both 48hr and 72hr. RC–relaxed circular DNA, DL–double-stranded linear DNA, SS–single stranded DNA.
Fig 2
Fig 2. RNA-seq overview.
A. Euclidean sample distance was mapped allowing unbiased ordering of samples based on sample similarity. B. Plot of distribution of average RPKM values per sample.
Fig 3
Fig 3. Mapping HBV-derived reads.
A. HBV transcripts were aligned based on the location of the shared polyA signal plus an additional 10 bases. Genomic transcripts are greater-than-genome length, with the terminally redundant portion apparent as overlap within the same transcript. B. Average reads-per-base (normalized to library size) from AdGFP-HBV 48hr (blue) and 72hr (red) samples were plotted along the HBV genome/transcripts. C. The HBV genome was broken down into 172 base sliding bins with 50% overlap between bins. Average number of reads-per-bin for AdGFP-HBV-infected PRHs at 48hr (blue) and 72hr (red) were plotted.
Fig 4
Fig 4. Mapping adenovirus-derived reads.
A. Average reads per base (normalized to library size) from AdGFP-HBV 48hr (light grey), AdGFP-HBV 72hr (dark grey), AdGFP 48hr (green), and AdGFP 72hr (red) was plotted along the sequence of the pAdEasy-1 vector. B. The pAdEasy-1 sequence was broken down into 5kb sliding bins with 50% overlap between bins. Average number of reads per bin (for both the + and—strand) was plotted for 48hr samples. AdGFP—strand (red), AdGFP-HBV-strand (blue), AdGFP + strand (green), AdGFP-HBV—strand (yellow). C. Reads per bin were plotted for 72hr samples as in B.
Fig 5
Fig 5. Differential-gene expression due to time in culture.
A. The top 100 most variable genes across all samples were visualized by heatmap. Gene-expression variation was calculated by Z-score, with red indicating an increase in expression compared to the mean across all samples, and blue indicating a decrease in expression. Uninfected 0hr samples were removed from the analysis to prevent a heavy bias due to the large changes within the first 24hr. B. Gene-expression changes in uninfected PRHs over time were plotted as the log10 RPKM value for genes in uninfected 0hr samples versus the log2 fold change compared to uninfected 0hr for genes in the indicated comparison. Yellow diamonds indicate DEG that were only differentially expressed in the first 24hr, red squares represent DEG at 24hr and 48hr but not 72hr, and blue circles represent DEG at 24hr, 48hr, and 72hr.
Fig 6
Fig 6. Overall analysis of HBV-mediated changes in gene expression.
A. Venn diagram of DEG from AdGFP 48hr to AdGFP-HBV 48hr (blue), AdGFP 72hr to AdGFP-HBV 72hr (yellow), AdGFP 48hr to AdGFP 72hr (green) and AdGFP-HBV 48hr to AdGFP-HBV 72hr (red) comparisons. The "HBV-specific" subset (described in text) is circled. B. Venn diagram of DEG from AdGFP 48hr to AdGFP-HBV 48hr (blue), AdGFP 72hr to AdGFP-HBV 72hr (yellow), and any DEG from all Uninfected/time-mediated comparison (green). The "HBV-only" subset is circled. C-D. HBV-mediated gene-expression changes were plotted for 48hr samples (C.) and 72hr samples (D.) as the log10 RPKM value for genes in AdGFP samples versus the log2 fold change compared to AdGFP for genes in the indicated comparison. Yellow diamonds indicate DEG in the "HBV-only" subset, red squares represent DEG in the "HBV-specific" subset, and blue circles represent all DEG in the AdGFP to AdGFP-HBV comparison at the indicated time point.
Fig 7
Fig 7. Description of HBV-only subset of differentially expressed genes.
Gene name, Ensembl ID, and associated protein name are given for genes within the HBV-only subset of genes. Fold changes comparing expression in AdGFP to AdGFP-HBV at the indicated time points is included, along with a heatmap depicting expression variation (by Z-score) across all samples.
Fig 8
Fig 8. HBV-mediated impact on time-mediated, differential-gene expression.
A-H. Individual gene expression was plotted as RPKM value over time for uninfected PRHs (black), AdGFP-infected PRHs (red), and AdGFP-HBV-infected PRHs (blue).
Fig 9
Fig 9. Confirmation of differentially expressed genes by qRT-PCR.
Expression of genes from the "HBV-only" and "HBV-specific" was confirmed by qRT-PCR (bars labeled qPCR). Expression is presented as fold change of AdGFP-HBV-infected cells compared to AdGFP-infected cells at the indicated time point. Fold change using the RPKM values described in the primary RNA-seq dataset was included for comparison of expression patterns (bars labeled RPKM).

References

    1. El-Serag HB. Epidemiology of viral hepatitis and hepatocellular carcinoma. Gastroenterology. 2012;142(6):1264–73 e1. 10.1053/j.gastro.2011.12.061 - DOI - PMC - PubMed
    1. Block TM, Mehta AS, Fimmel CJ, Jordan R. Molecular viral oncology of hepatocellular carcinoma. Oncogene. 2003;22(33):5093–107. Epub 2003/08/12. - PubMed
    1. Scaglione SJ, Lok AS. Effectiveness of hepatitis B treatment in clinical practice. Gastroenterology. 2012;142(6):1360–8 e1. 10.1053/j.gastro.2012.01.044 - DOI - PubMed
    1. GLOBOCAN 2012 v1.0 [Internet]. IARC CancerBase No. 11. 2013. Available from: http://globocan.iarc.fr.
    1. Gish RG, Given BD, Lai CL, Locarnini SA, Lau JY, Lewis DL, et al. Chronic hepatitis B: virology, natural history, current management and a glimpse at future opportunities. Antiviral research. 2015. - PubMed

Publication types