Review
. 2016 Jun;21(6):924-38.
doi: 10.1016/j.drudis.2016.02.003. Epub 2016 Feb 15.

Recent developments in using mechanistic cardiac modelling for drug safety evaluation

Affiliations
Review

Recent developments in using mechanistic cardiac modelling for drug safety evaluation

Mark R Davies et al. Drug Discov Today. 2016 Jun.

Abstract

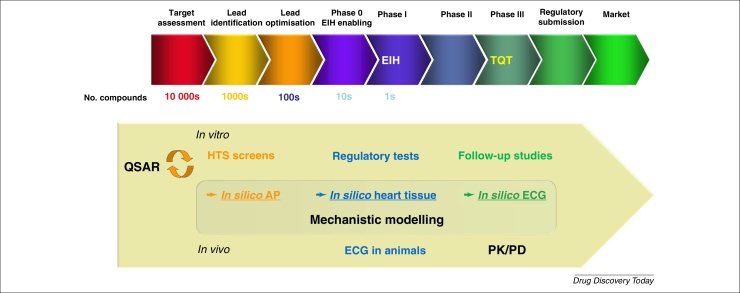
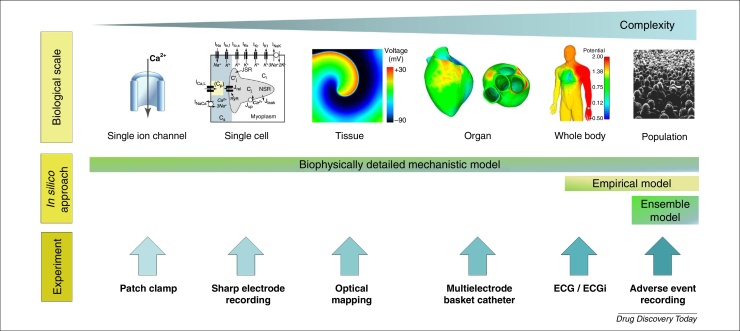
On the tenth anniversary of two key International Conference on Harmonisation (ICH) guidelines relating to cardiac proarrhythmic safety, an initiative aims to consider the implementation of a new paradigm that combines in vitro and in silico technologies to improve risk assessment. The Comprehensive In Vitro Proarrhythmia Assay (CiPA) initiative (co-sponsored by the Cardiac Safety Research Consortium, Health and Environmental Sciences Institute, Safety Pharmacology Society and FDA) is a bold and welcome step in using computational tools for regulatory decision making. This review compares and contrasts the state-of-the-art tools from empirical to mechanistic models of cardiac electrophysiology, and how they can and should be used in combination with experimental tests for compound decision making.


Figures

Figure 1
Figure 1
Schematic of a typical drug discovery pipeline with how and when different in vitro, in vivo and in silico techniques could be applied for cardiac risk assessment. In the ideal state, each of the studies should provide sufficient information to support and aid decision making fully for the ascending milestone points along the drug discovery and development pipeline. Abbreviations: EIH, entry into human; TQT, thorough QT study; AP, Action Potential.
Figure 2
Figure 2
Complex heritage and interrelation between some frequently used cardiac electrophysiological cell models. Lines indicate how models inherit formulations from ‘parent’ models, whereas node colour indicates the reported species type, and shape is the reported cell type of the model. The inheritance shown in this figure was adapted, with permission, from .
Figure 3
Figure 3
Schematic diagram showing that cardiac models (top) and corresponding experimental platforms (bottom) have been developed for use at different scales and levels of complexity. From left to right: single ion channel, single cell, 2D/3D tissue, whole organ and whole body (ECG). The biophysically detailed model has been used across scales from single ion channel to torso ECG (bottom-up modelling), whereas the empirical models tend to focus on modelling in vivo data such as ECG (top-down modelling). Ensemble approaches offer an opportunity to represent variants (virtual subjects) within a population. Images within the figure were adapted, with permission, from , , , and from StockSnap (https://stocksnap.io).
Figure 4
Figure 4
An illustration of the dependence of performance statistics, and the uncertainty in these, on the number of compounds used in a validation study. Here, we compare whether compounds caused 10% prolongation of QT interval in a rabbit left-ventricular wedge with simulations based on multiple ion channel automated PatchXPress® screens. We plot the (left) sensitivity and (right) accuracy of the assay as a function of the number of compounds that are considered in the validation set (n = 77 available in total). The blue and red data are from the same compounds but considered in a different (randomly permuted) order, note that both measures have to start at either 0% or 100% (the first classification is right or wrong), and that the entries for n = 77 must be identical. 95% confidence intervals on these statistics are generated using Wilson's Score Interval, and are shown with the shaded regions. The data shown are taken, with permission, from (available to download from: http://www.cs.ox.ac.uk/chaste/download.html – Jptm2013Beattie project).
Figure 5
Figure 5
The impact of the protocol-related parameters when simulating an increasing concentration of quinidine. (a) The effect of stimulation pulse amplitude on AP. The solid lines show control AP and the dashed lines show the AP with 12.9 μm quinidine. The AP traces simulated with −15 μA/μF stimulation pulse and −25 μA/μF stimulation pulse, coloured in red and blue, respectively. (b) The APD90 dose–response (with ascending concentration of quinidine) simulated using 3 ms (coloured in orange) and 5 ms (coloured in turquoise) stimulation pulse and after two (shown in dashed line) or 200 (shown in solid line) paces. (ci–iii) Simulated AP with different concentration of quinidine when applying various pacing protocols (stimulation pulse amplitude: −15, −18, −20, −22 or −25 μA/μF; stimulation pulse duration: 3, 4 or 5 ms; number of pulses: 1–200 pulses). The red line shows the AP simulated using stimulation protocol published with the original model and after 200 pulses and black line shows the AP simulated using other variants of stimulation protocols as mentioned above. (di,ii) shows dose–response of the APD90 and maximum upstroke velocity simulated using the variants of stimulation protocol used for subfigure (ci–iii). The red line shows the simulation result obtained using the stimulation protocol published with the original model, the grey shade marks out the variability induced by applying the variants (as above) of stimulation protocols.
Figure 6
Figure 6
Integrating an understanding of PK allows translation into a cardiac biomarker, in this case changes to action potential duration (APD50 and APD90) for two formulations of clarithromycin.

References

    1. Sood S. A novel multi-tissue RNA diagnostic of healthy ageing relates to cognitive health status. Genome Biol. 2015;16:185. - PMC - PubMed
    1. Hendriks B. Negative modeling results: a dime a dozen or a stepping stone to scientific discovery? CPT Pharmacometrics Syst. Pharmacol. 2013;2:e48. - PMC - PubMed
    1. DiFrancesco D., Noble D. A model of cardiac electrical activity incorporating ionic pumps and concentration changes. Philos. Trans. R. Soc. Lond. B: Biol. Sci. 1985;307:353–398. - PubMed
    1. Gobburu J.V., Lesko L.J. Quantitative disease, drug, and trial models. Annu. Rev. Pharmacol. Toxicol. 2009;49:291–301. - PubMed
    1. Suryawanshi S. The current role of model-based drug development. Expert Opin. Drug Discov. 2010;5:311–321. - PubMed

LinkOut - more resources