. 2016 Feb 19:6:20518.
doi: 10.1038/srep20518.

Discovering gene re-ranking efficiency and conserved gene-gene relationships derived from gene co-expression network analysis on breast cancer data

Affiliations

Discovering gene re-ranking efficiency and conserved gene-gene relationships derived from gene co-expression network analysis on breast cancer data

Marilena M Bourdakou et al. Sci Rep. .

Abstract

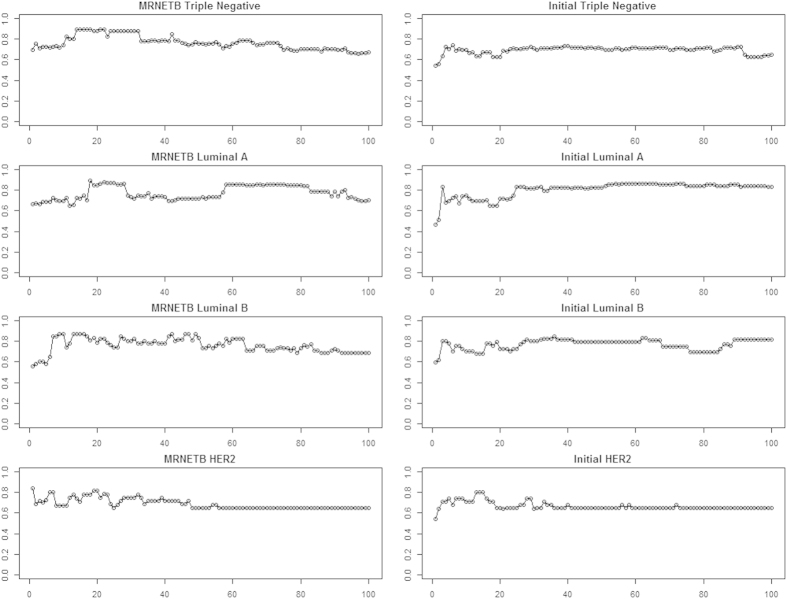
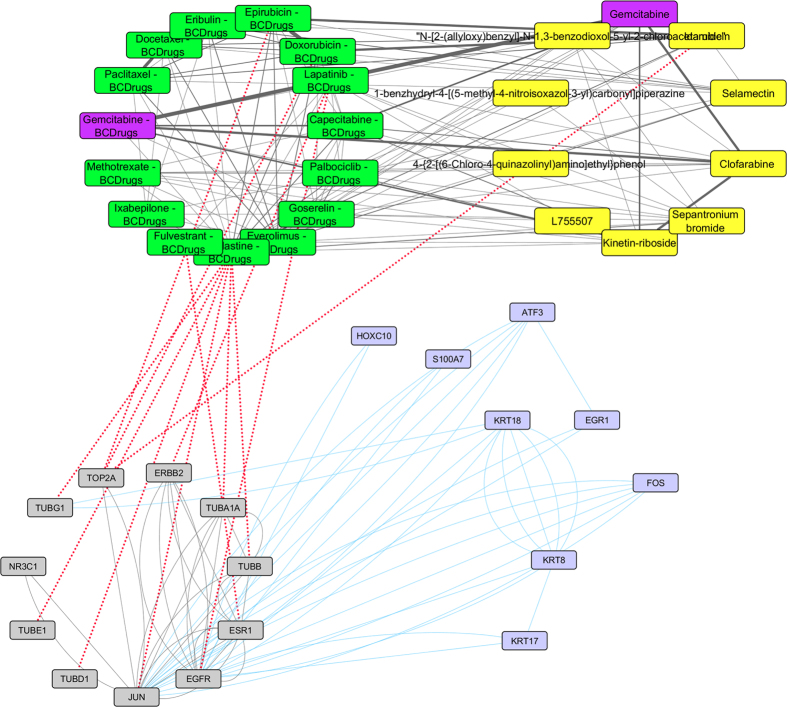
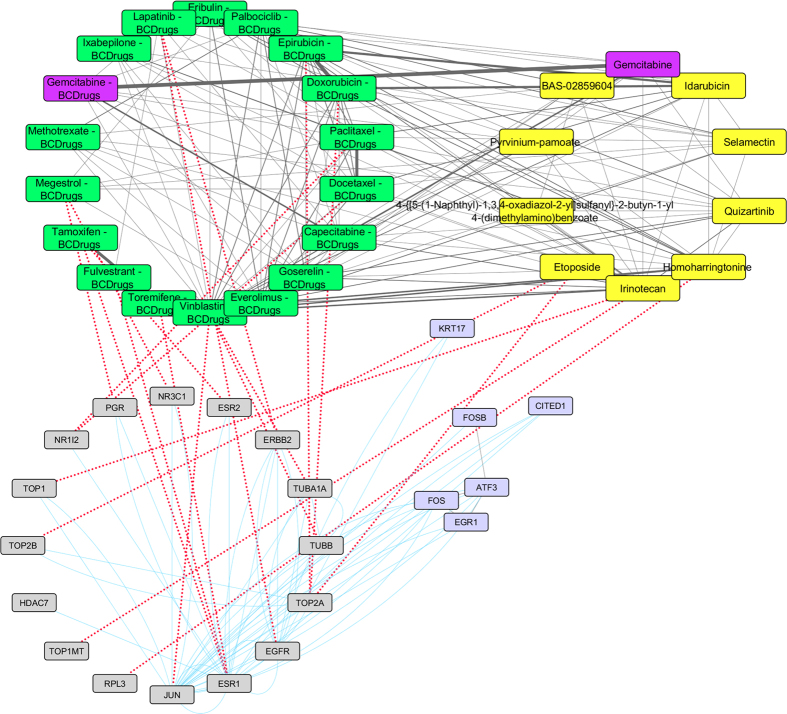
Systemic approaches are essential in the discovery of disease-specific genes, offering a different perspective and new tools on the analysis of several types of molecular relationships, such as gene co-expression or protein-protein interactions. However, due to lack of experimental information, this analysis is not fully applicable. The aim of this study is to reveal the multi-potent contribution of statistical network inference methods in highlighting significant genes and interactions. We have investigated the ability of statistical co-expression networks to highlight and prioritize genes for breast cancer subtypes and stages in terms of: (i) classification efficiency, (ii) gene network pattern conservation, (iii) indication of involved molecular mechanisms and (iv) systems level momentum to drug repurposing pipelines. We have found that statistical network inference methods are advantageous in gene prioritization, are capable to contribute to meaningful network signature discovery, give insights regarding the disease-related mechanisms and boost drug discovery pipelines from a systems point of view.


Figures

Figure 1
Figure 1. Analysis workflow was followed eight times for each of the four breast cancer subtypes and stages – initially TCGA mRNA Breast cancer gene expression datasets were statistically analyzed by means of LIMMA statistical R package in order to find the top 1000 differentially expressed genes, for each case.
Derived gene lists were used as input for co-expression network reconstruction using 11 different network inference methods, one ensemble scheme and six biological. PageRank algorithm was applied to re-rank gene lists based on each network topology along with the existing expression profiles. For the re-ranked lists, we applied an SVM-based classification scheme using as training set the TCGA datasets, tested on a number of breast cancer GEO datasets available for each subtype and stage. Using the most efficient network inference method for each category, we derived to common subnetwork patterns across all datasets. In the sequel, we further investigated the nodes of each common subnetwork pattern regarding their capacity to reveal basic mechanisms and boost certain drug repurposing pipelines for each subtype and stage.
Figure 2
Figure 2. Box plots of the mean accuracy rates of the top 100 sequential genes from all ranked and re-ranked gene lists in combination with PageRank reconciling method, using hold out validation with train set the TCGA expression values and test set the expression values from GEO independent datasets for breast cancer stages.
Figure 3
Figure 3. Box plots of the mean accuracy rates of the top 100 sequential genes from all ranked and re-ranked gene lists in combination with PageRank reconciling method, using hold out validation with train set the TCGA expression values and test set the expression values from GEO independent datasets for breast cancer subtypes.
Figure 4
Figure 4. Mean accuracy rates of the top 100 sequential genes from the Genenet network inference method and the Initial for each breast cancer stage.
Figure 5
Figure 5. Mean accuracy rates of the top 100 sequential genes from the MRNETB network inference method and the Initial for each breast cancer subtype.
Figure 6
Figure 6. Network pattern for each breast cancer stage and the common edges across them.
Figure 7
Figure 7. Network pattern for each breast cancer subtype and the common interactions across Luminal A and Luminal B.
Figure 8
Figure 8. Super Network for breast cancer Stage I- consists of 4 sub-networks: 1) two drug – drug networks: with yellow cycle are represented the 20 drugs from LINCS and with green cycle the 25 therapeutic breast cancer drugs 2) drug – target network: grey round rectangles represent the target genes of all drugs (red dots edges) and 3) target - pattern genes network: physical interactions (blue edges) between target genes and genes from the network pattern (purple round rectangles).
One out of the 25 FDA approved Breast cancer drugs (Gemcitabine), was found in the top 20 drug list from LINCS from breast cancer stage I (dark magenta).
Figure 9
Figure 9. Highlighted target genes that physically interact with genes from the breast cancer stage I common network pattern and their corresponding repurposed drugs from LINCS, along with their structurally similar Breast cancer drugs.
Figure 10
Figure 10. Super Network for breast cancer Stage II- consists of 4 sub-networks: 1) two drug – drug networks: with yellow cycle are represented the 20 drugs from LINCS and with green cycle the 25 therapeutic breast cancer drugs 2) drug – target network: grey round rectangles represent the target genes of all drugs (red dots edges) and 3) target - pattern genes network: physical interactions (blue edges) between target genes and genes from the network pattern (purple round rectangles).
One out of the 25 FDA approved Breast cancer drugs (Palbociclib), was found in the top 20 drug list from LINCS from breast cancer stage II (deep pink).
Figure 11
Figure 11. Highlighted target genes that physically interact with genes from the breast cancer stage II common network pattern and their corresponding repurposed drugs from LINCS, along with their structurally similar Breast cancer drugs.
Figure 12
Figure 12. Super Network for breast cancer Stage III- consists of 4 sub-networks: 1) two drug – drug networks: with yellow cycle are represented the 20 drugs from LINCS and with green cycle the 25 therapeutic breast cancer drugs 2) drug – target network: grey round rectangles represent the target genes of all drugs (red dots edges) and 3) target - pattern genes network: physical interactions (blue edges) between target genes and genes from the network pattern (purple round rectangles).
One out of the 25 FDA approved Breast cancer drugs (Gemcitabine), was found in the top 20 drug list from LINCS from breast cancer stage III (dark magenta).
Figure 13
Figure 13. Highlighted target genes that physically interact with genes from the breast cancer stage III common network pattern and their corresponding repurposed drugs from LINCS, along with their structurally similar Breast cancer drugs.
Figure 14
Figure 14. Super Network for breast cancer Stage IV- consists of 4 sub-networks: 1) two drug – drug networks: with yellow cycle are represented the 20 drugs from LINCS and with green cycle the 25 therapeutic breast cancer drugs 2) drug – target network: grey round rectangles represent the target genes of all drugs (red dots edges) and 3) target – pattern genes network: physical interactions (blue edges) between target genes and genes from the network pattern (purple round rectangles).
One from the 25 FDA approved Breast cancer drugs (Gemcitabine), was found in the top 20 drug list from LINCS from breast cancer stage IV (dark magenta).
Figure 15
Figure 15. Highlighted target genes that physical interact with genes from the breast cancer stage IV common network pattern and their corresponding repurposed drugs from LINCS with the structurally similar Breast cancer drugs.
Figure 16
Figure 16. Super Network for Triple Negative breast cancer - consists of 4 sub-networks: 1) two drug – drug networks: with yellow cycle are represented the 20 drugs from LINCS and with green cycle the 25 therapeutic breast cancer drugs 2) drug – target network: grey round rectangles represent the target genes of all drugs (red dots edges) and 3) target – pattern genes network: physical interactions (blue edges) between target genes and genes from the network pattern (purple round rectangles).
Two target genes are also in the Triple Negative common network pattern (turquoise).
Figure 17
Figure 17. Highlighted target genes that physical interact with genes from the Triple Negative breast cancer subtype common network pattern and their corresponding repurposed drugs from LINCS with the structurally similar Breast cancer drugs.
Figure 18
Figure 18. Super Network for Luminal A breast cancer subtype- consists of 4 sub-networks: 1) two drug – drug networks: with yellow cycle are represented the 20 drugs from LINCS and with green cycle the 25 therapeutic breast cancer drugs 2) drug – target network: grey round rectangles represent the target genes of all drugs (red dots edges) and 3) target – pattern genes network: physical interactions (blue edges) between target genes and genes from the network pattern (purple round rectangles).
Two from the 25 FDA approved Breast cancer drugs (Gemcitabine and Palbociclib), was found in the top 20 drug list from LINCS from Luminal A breast cancer (dark magenta and deep pink respectively).
Figure 19
Figure 19. Highlighted target genes that physical interact with genes from the Luminal A breast cancer subtype common network pattern and their corresponding repurposed drugs from LINCS with the structurally similar Breast cancer drugs.
Figure 20
Figure 20. Super Network for Luminal B breast cancer subtype- consists of 4 sub-networks: 1) two drug – drug networks: with yellow cycle are represented the 20 drugs from LINCS and with green cycle the 25 therapeutic breast cancer drugs 2) drug – target network: grey round rectangles represent the target genes of all drugs (red dots edges) and 3) target – pattern genes network: physical interactions (blue edges) between target genes and genes from the network pattern (purple round rectangles).
Two target genes are also in the Luminal B common network pattern (turquoise).
Figure 21
Figure 21. Highlighted target genes that physical interact with genes from the Luminal B breast cancer subtype common network pattern and their corresponding repurposed drugs from LINCS with the structurally similar Breast cancer drugs.
Figure 22
Figure 22. Super Network for HER2 breast cancer subtype- consists of 4 sub-networks: 1) two drug – drug networks: with yellow cycle are represented the 20 drugs from LINCS and with green cycle the 25 therapeutic breast cancer drugs 2) drug – target network: grey round rectangles represent the target genes of all drugs (red dots edges) and 3) target – pattern genes network: physical interactions (blue edges) between target genes and genes from the network pattern (purple round rectangles).
Two from the 25 FDA approved Breast cancer drugs (Gemcitabine and Palbociclib), were found in the top 20 drug list from LINCS from HER2 breast cancer (dark magenta and deep pink respectively). One target gene is also in the HER2 common network pattern (turquoise).
Figure 23
Figure 23. Highlighted target genes that physical interact with genes from the HER2 breast cancer subtype common network pattern and their corresponding repurposed drugs from LINCS with the structurally similar Breast cancer drugs.

Similar articles

Cited by

References

    1. Howell A. et al. Risk determination and prevention of breast cancer. Breast Cancer Res 16, 446 10.1186/s13058-014-0446-2 (2014). - DOI - PMC - PubMed
    1. Hutchinson L. Breast cancer: challenges, controversies, breakthroughs. Nat Rev Clin Oncol 7, 669–670 10.1038/nrclinonc.2010.192 (2010). - DOI - PubMed
    1. Zhang J. et al. Weighted frequent gene co-expression network mining to identify genes involved in genome stability. PLoS Comput Biol 8, e1002656 10.1371/journal.pcbi.1002656 (2012). - DOI - PMC - PubMed
    1. Cheng F. et al. Prediction of drug-target interactions and drug repositioning via network-based inference. PLoS Comput Biol 8, e1002503 10.1371/journal.pcbi.1002503 (2012). - DOI - PMC - PubMed
    1. Cheng F., Zhao J. & Zhao Z. Advances in computational approaches for prioritizing driver mutations and significantly mutated genes in cancer genomes. Briefings in bioinformatics 10.1093/bib/bbv068 (2015). - DOI - PMC - PubMed

Substances