. 2016 Feb 19:6:21807.
doi: 10.1038/srep21807.

Long-term High Fat Ketogenic Diet Promotes Renal Tumor Growth in a Rat Model of Tuberous Sclerosis

Affiliations

Long-term High Fat Ketogenic Diet Promotes Renal Tumor Growth in a Rat Model of Tuberous Sclerosis

Arkadiusz D Liśkiewicz et al. Sci Rep. .

Abstract

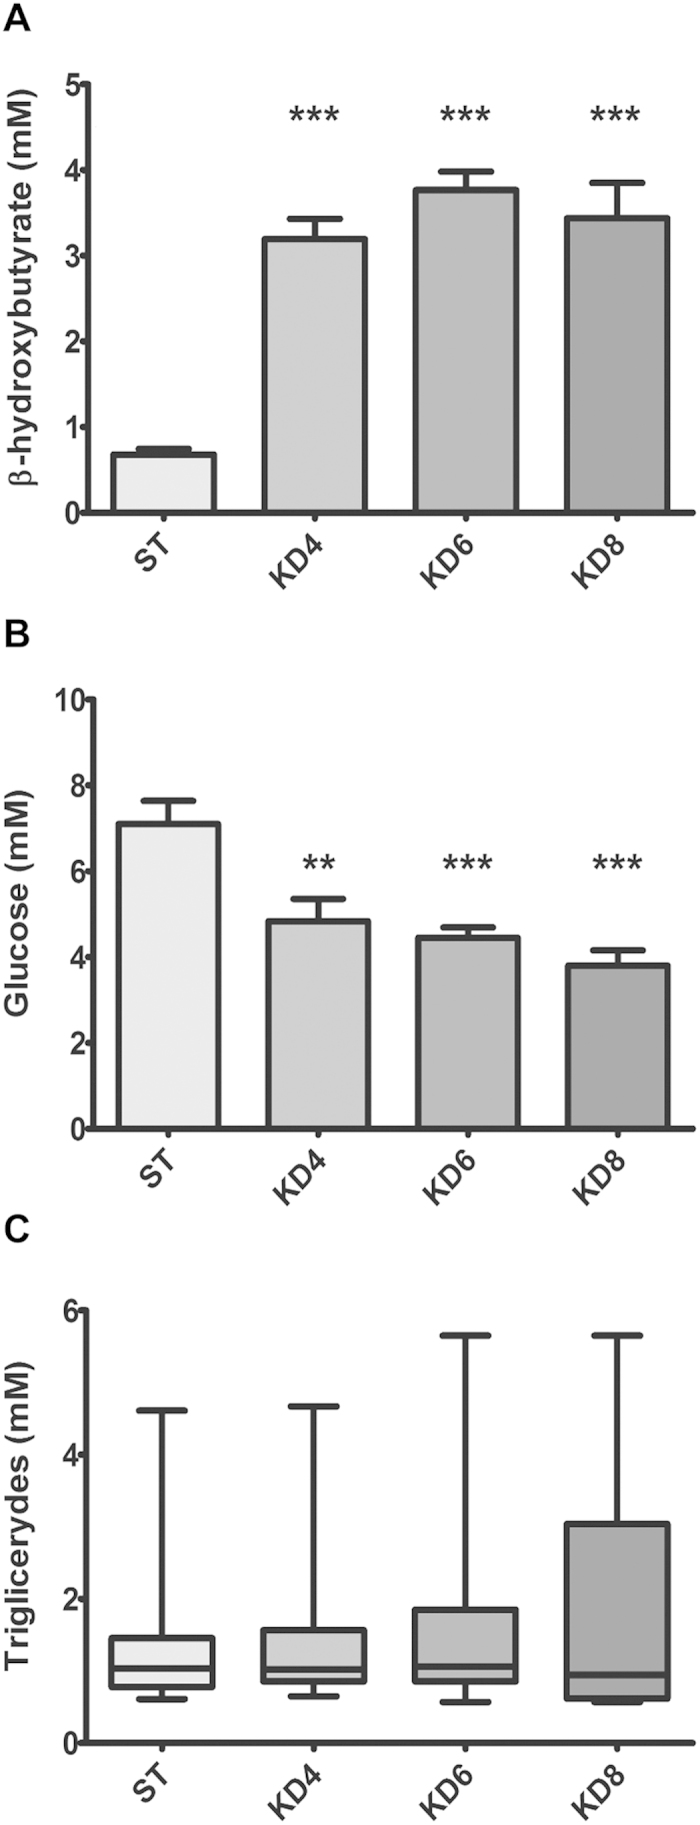
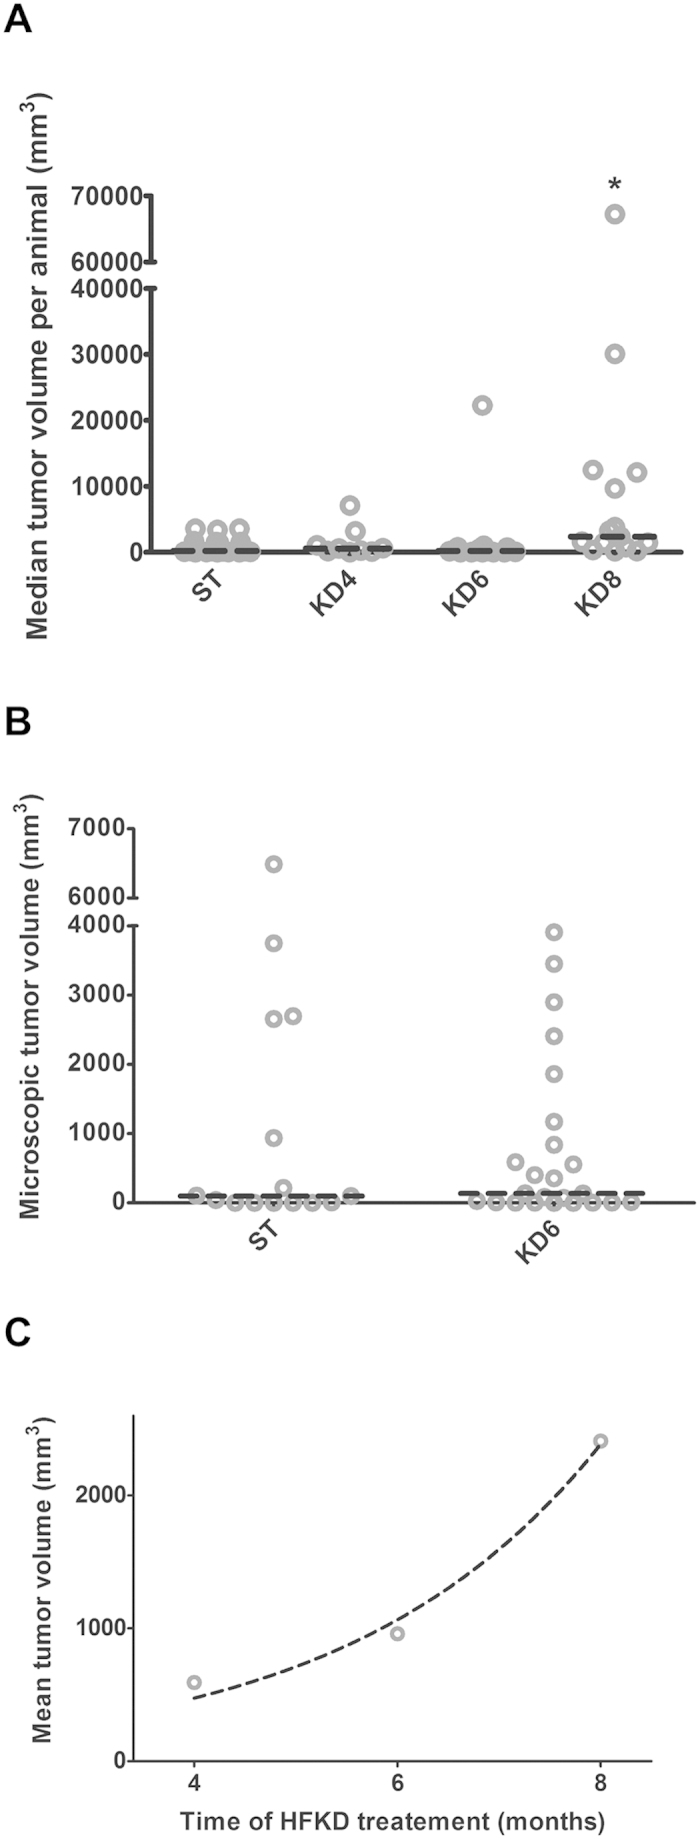
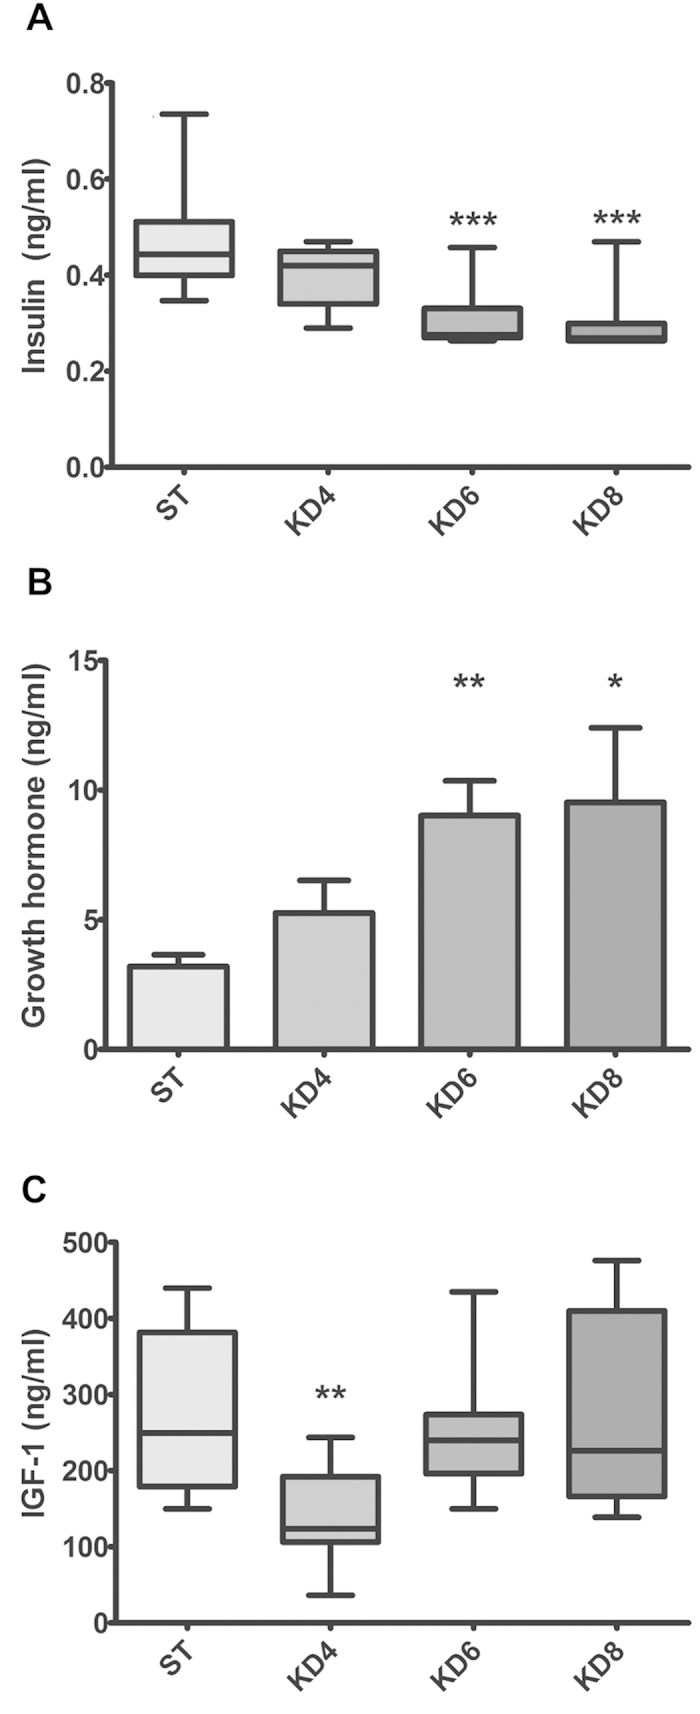
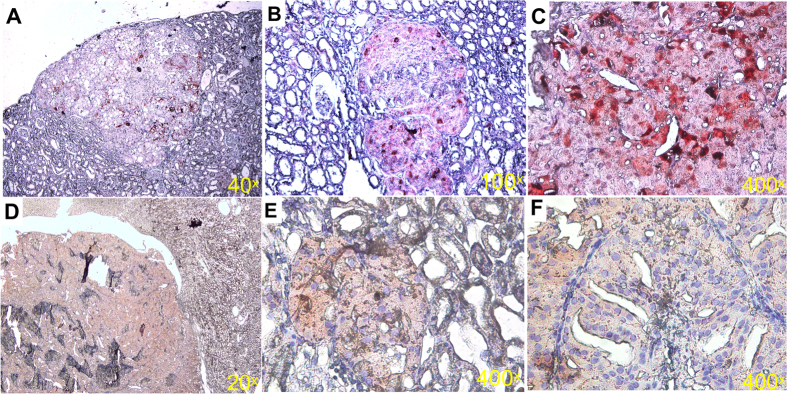
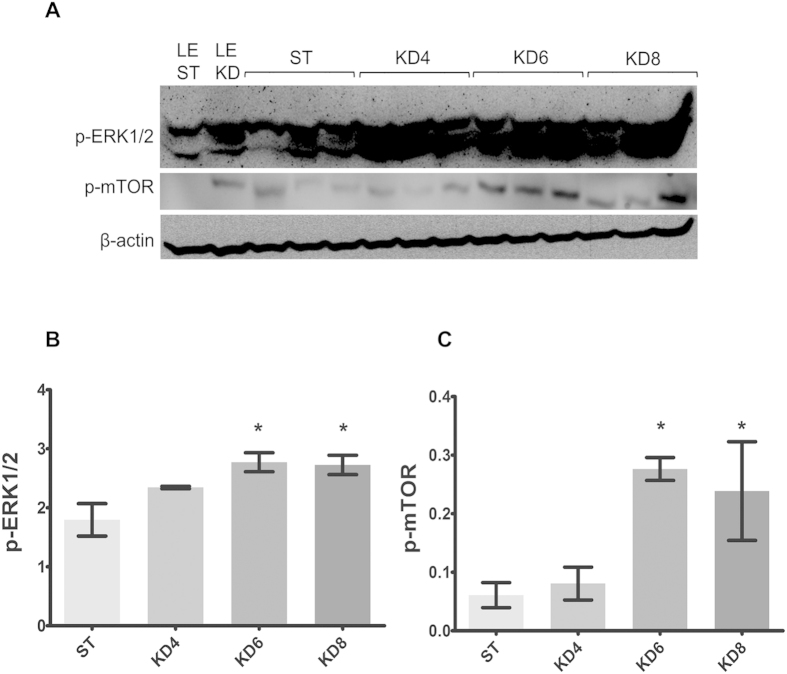
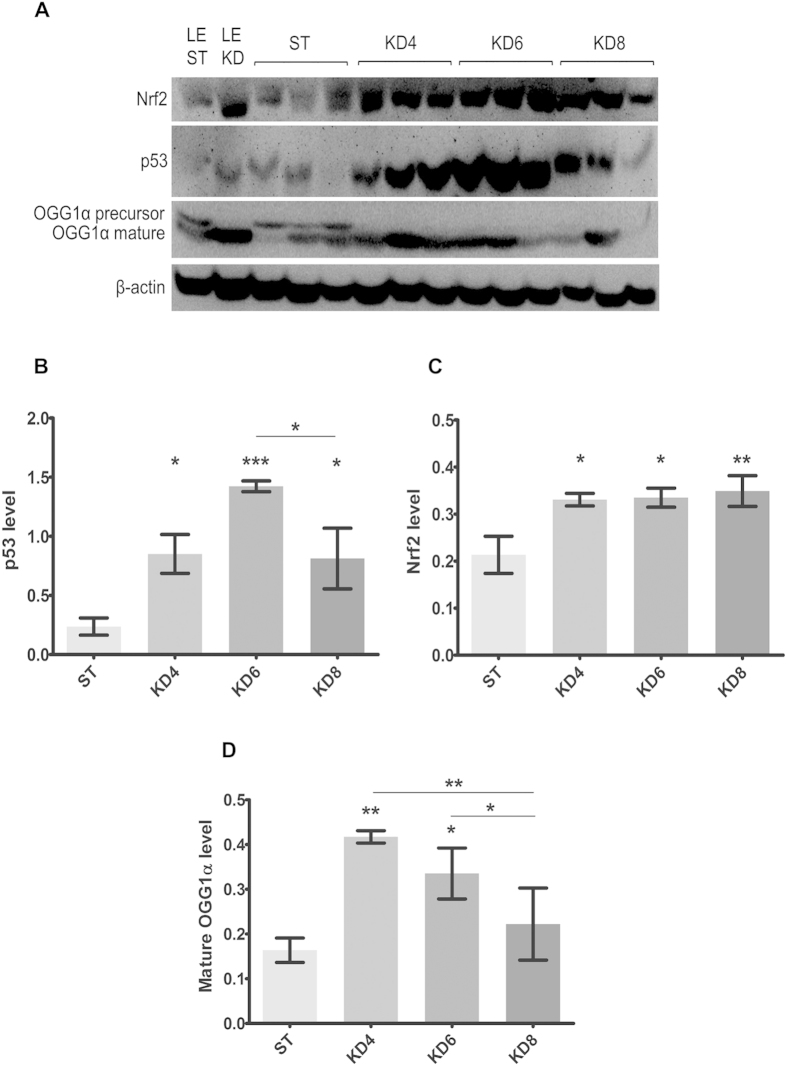
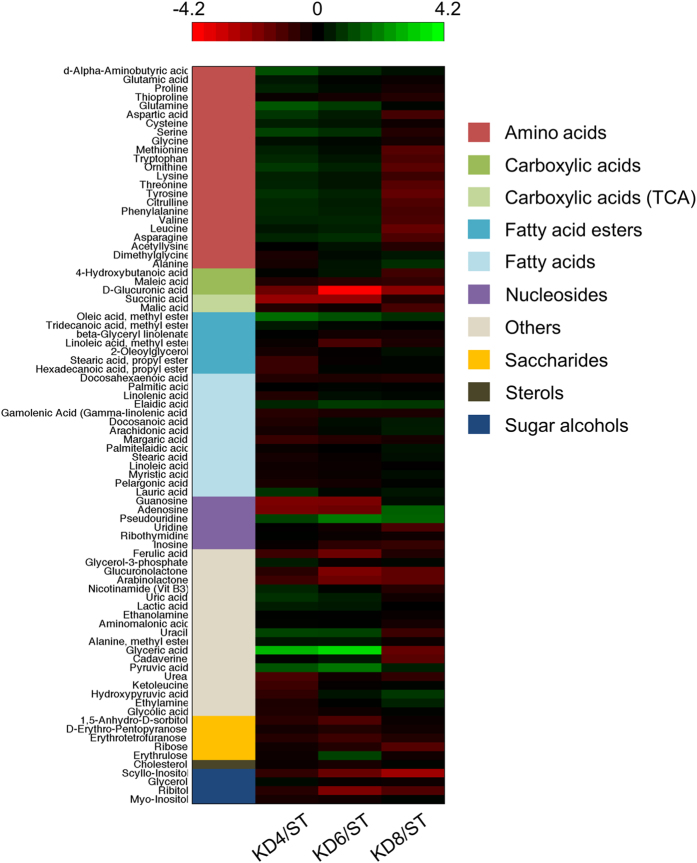
Nutritional imbalance underlies many disease processes but can be very beneficial in certain cases; for instance, the antiepileptic action of a high fat and low carbohydrate ketogenic diet. Besides this therapeutic feature it is not clear how this abundant fat supply may affect homeostasis, leading to side effects. A ketogenic diet is used as anti-seizure therapy i.a. in tuberous sclerosis patients, but its impact on concomitant tumor growth is not known. To examine this we have evaluated the growth of renal lesions in Eker rats (Tsc2+/-) subjected to a ketogenic diet for 4, 6 and 8 months. In spite of existing opinions about the anticancer actions of a ketogenic diet, we have shown that this anti-seizure therapy, especially in its long term usage, leads to excessive tumor growth. Prolonged feeding of a ketogenic diet promotes the growth of renal tumors by recruiting ERK1/2 and mTOR which are associated with the accumulation of oleic acid and the overproduction of growth hormone. Simultaneously, we observed that Nrf2, p53 and 8-oxoguanine glycosylase α dependent antitumor mechanisms were launched by the ketogenic diet. However, the pro-cancerous mechanisms finally took the ascendency by boosting tumor growth.


Figures

Figure 1
Figure 1. Measurements of blood substrate levels in Eker rats (Tsc2+/−).
HFKD increases ketone body levels (A) with a decline in glucose concentrations (B) and unchanged triglyceride amounts (C). Results are given as a mean ±S.E.M ((A,B) ANOVA with a Tukey’s post hoc test) or median (C) whiskers represent 5–95 percentiles; Kruskal-Wallis ANOVA with a Dunn’s post hoc test). KD4, KD6, KD8 – animal groups treated with HFKD for four, six or eight mo., respectively; ST – control animals fed with a standard diet. **P < 0.01, ***p < 0.001 as compared to ST.
Figure 2
Figure 2. Macroscopic and microscopic renal tumor volumes in Eker rats (Tsc2+/−) treated with a ketogenic or a standard diet.
(A) Macroscopic measurements of renal tumor volumes per single animal (*p < 0.05 as compared to ST for Kruskal-Wallis ANOVA with Dunn’s post hoc test). (B) Microscopic evaluation of renal tumor volumes per single animal (Wilcoxon Mann-Whitney test). (C) Exponential changes of mean tumor size per group in rats with the time of the HFKD treatment (R2 = 0.97). The dashed, horizontal line indicates the median tumor volume. KD4, KD6, KD8 – groups treated with HFKD for four, six or eight mo., respectively; ST – control animals fed with a standard diet.
Figure 3
Figure 3. Measurements of blood protein concentrations in Eker rats (Tsc2+/−).
(A) Insulin concentrations declined in HFKD treated rats. Growth hormone was released in ketogenic groups (B) whereas IGF-1 levels fluctuated depending on the time of the investigation (C). Results are given as a median ((A,C) whiskers represent 5–95 percentiles; Kruskal-Wallis ANOVA with a Dunn’s post hoc test) or mean ±S.E.M ((B) ANOVA with a Dunnett’s post hoc test). KD4, KD6, KD8 – animal groups treated with HFKD for four, six or eight mo., respectively; ST – control animals fed with a standard diet. *P < 0.05, **p < 0.01, ***p < 0.001 as compared to ST.
Figure 4
Figure 4. Immunohistochemistry analysis of the Eker rat (Tsc2+/−) renal tumors shows hyperactivation of ERK1/2 and mTOR kinases within lesions, relative to the surrounding tissue.
Sections were prepared and stained using p-ERK1/2 Thr202/Thr204 (AC red) and p-mTOR Ser2448 (DF red) antibodies. Representative sections are shown.
Figure 5
Figure 5. Immunoblot analysis of kidney lysates.
(A) Blot membranes were incubated with the antibodies against p-ERK1/2 Thr 202/204 and p-mTOR Ser 2448. The mean integrated optical density is related to actin for p-ERK1/2 (B) and p-mTOR (C) activity. Results are given as a mean ± S.E.M. KD4, KD6, KD8 – groups of Eker rats (Tsc2+/−) treated with HFKD for four, six or eight mo., respectively; ST – Eker rats fed with a standard diet; LE ST – wild-type Long Evans rats treated with a standard diet; LE KD – wild-type Long Evans rats treated with a ketogenic diet similarly to the KD6 group. *P < 0.05 as compared to ST for ANOVA with a Fisher post hoc test.
Figure 6
Figure 6. Immunoblot analysis of kidney lysates.
(A) Blot membranes were incubated with the antibodies against Nrf2, p53 and 8-oxoguanine glycosylase α (OGG1α). The mean integrated optical density is related to actin for Nrf2 (B), p53 (C) and mature 8-oxoguanine glycosylase α (D) levels. Results are given as a mean ± S.E.M. KD4, KD6, KD8 – groups of Eker rats (Tsc2+/−) treated with HFKD for four, six or eight mo., respectively; ST – Eker rats fed with a standard diet; LE ST – wild-type Long Evans rats treated with a standard diet; LE KD – wild-type Long Evans rats treated with a ketogenic diet similarly to the KD6 group. *P < 0.05, **p < 0.01, ***p < 0.001 as compared to ST unless otherwise stated (horizontal line) for ANOVA with a Fisher post hoc test.
Figure 7
Figure 7. A heatmap visualisation of the changes in metabolite levels between the treatment groups KD4 (N = 4), KD6 (N = 6), KD8 (N = 5) and the control ST (N = 6).
Each of the three heatmap columns represents one of the diet groups' (KD4, KD6 and KD8 respectively) log2 fold change in comparison to the control, with metabolite levels averaged across all of the specimens within each group. The compound group that each metabolite belongs to is colour-coded in the first column of the heatmap, with the mapping provided in the legend. Black indicates a log2 fold change of zero, representing a lack of change between the treatment group and the control. Increasing brightness of green indicates a higher level of the metabolite in the treatment group in comparison to the control (log2 fold change >0). Increasing brightness of red indicates a lower level of the metabolite in the treatment group in comparison to the control (log2 fold change <0). The log2 fold change corresponding to a given colour on the heatmap can be elucidated from the colour bar.

References

    1. Crino P. B., Nathanson K. L. & Henske E. P. The tuberous sclerosis complex. N. Engl. J. Med. 28, 1345–56 (2006). - PubMed
    1. Franz D. N. Everolimus in the treatment of subependymal giant cell astrocytomas, angiomyolipomas, and pulmonary and skin lesions associated with tuberous sclerosis complex. Biologics 7, 211–221 (2013). - PMC - PubMed
    1. Ieremia E. & Robson A. Cutaneous PEComa: a rare entity to consider in an unusual site. Am. J. Dermatopathol. 36, 198–201 (2014). - PubMed
    1. Varma S., Gupta S., Talwar J., Forte F. & Dhar M. Renal epithelioid angiomyolipoma: a malignant disease. J. Nephrol. 24, 18–22 (2011). - PubMed
    1. Yang P. et al. Renal cell carcinoma in tuberous sclerosis complex. Am. J. Surg. Pathol. 38, 895–909 (2014). - PMC - PubMed

Publication types

MeSH terms