Review
. 2016 Feb 19;118(4):750-69.
doi: 10.1161/CIRCRESAHA.115.306247.

Imaging Atherosclerosis

Affiliations
Review

Imaging Atherosclerosis

Jason M Tarkin et al. Circ Res. .

Abstract

Advances in atherosclerosis imaging technology and research have provided a range of diagnostic tools to characterize high-risk plaque in vivo; however, these important vascular imaging methods additionally promise great scientific and translational applications beyond this quest. When combined with conventional anatomic- and hemodynamic-based assessments of disease severity, cross-sectional multimodal imaging incorporating molecular probes and other novel noninvasive techniques can add detailed interrogation of plaque composition, activity, and overall disease burden. In the catheterization laboratory, intravascular imaging provides unparalleled access to the world beneath the plaque surface, allowing tissue characterization and measurement of cap thickness with micrometer spatial resolution. Atherosclerosis imaging captures key data that reveal snapshots into underlying biology, which can test our understanding of fundamental research questions and shape our approach toward patient management. Imaging can also be used to quantify response to therapeutic interventions and ultimately help predict cardiovascular risk. Although there are undeniable barriers to clinical translation, many of these hold-ups might soon be surpassed by rapidly evolving innovations to improve image acquisition, coregistration, motion correction, and reduce radiation exposure. This article provides a comprehensive review of current and experimental atherosclerosis imaging methods and their uses in research and potential for translation to the clinic.

Keywords: atherosclerosis; coronary artery disease; molecular imaging; multimodal imaging; risk factors.


Figures

Figure 1.
Figure 1.
Multimodal approach to atherosclerosis imaging. A representative illustration of current and emerging atherosclerosis imaging modalities. Each modality offers unique measurements of disease severity. Together, this information can be used to determine anatomic and hemodynamic consequences of atherosclerosis, complimented by detail on plaque composition, overall disease burden, and current metabolic activity acting within an individual patient. A, X-ray angiography showing multiple right coronary artery atherosclerotic lesions (arrows) resulting in significant luminal narrowing; B, virtual histology intravascular ultrasound (VH-IVUS) demonstrating coronary plaque with high content of necrotic core (red), as well as dense calcium (white) and fibro-fatty regions (dark/light green); C, Computed tomographic (CT) angiography showing noncalcified plaque in the left anterior descending artery with positive remodeling (dashed line); D, single-photon emission computed tomography (SPECT) myocardial perfusion scan with stress-induced perfusion defect (arrow); E, 3D volume rendered CT whole-heart image; F, optical coherence tomography (OCT) image of a coronary plaque showing lipid (*), characterized as signal-poor regions with poorly demarcated borders; G, OCT image of a lipid-rich coronary plaque displaying thin overlying fibrous cap (arrow), indicative of thin-cap fibroatheroma; H, Fused 18F-NaF positron emission tomography (PET)–CT image showing high left anterior descending artery tracer uptake (arrow) revealing active plaque microcalcification; I, 3-T magnetic resonance (MR) contrast-angiography performed with dual ECG and respiratory navigator gating showing clear delineation of the proximal left-sided coronary vessels. Panel H adapted from Joshi et al.
Figure 2.
Figure 2.
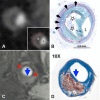
Noninvasive imaging of atherosclerotic plaque composition. Coronary artery shown in cross section, demonstrating napkin-ring sign on contrast-enhanced computed tomography (CT) (A) with corresponding histology confirming presence of advanced fibroatheroma (B). Area of low attenuation (white star) abutting lumen (L) seen on CT corresponds to necrotic core (black stars) on histology. High-attenuation circumferential outer rim on CT image (dashed red line) corresponds to fibrous plaque tissue (black arrows). Magnetic resonance image (MRI) of carotid artery shown in axial view with 3D time-of-flight MRI (C). Thin fibrous cap (blue arrows) demonstrated by missing area of hypodense juxtaluminal band (red asterisk) on MRI, confirmed by histology (D). Adapted from Maurovich-Horvat et al (A and B; copyright ©2010, Elsevier) and Yuan et al (C and D; copyright ©2002, American Heart Association, Inc) with permission of the publishers.
Figure 3.
Figure 3.
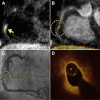
Hyperintense coronary signal on T1-weighted magnetic resonance image (MRI). A, T1-weighted MRI showing hyperintense signal within the wall of the right coronary artery (arrow), highlighted by fused MRI (circle, B); C, X-ray angiography shows severe stenosis in corresponding coronary segment, with lipid-rich plaque in this same region on optical coherence tomography (OCT) (D). Adapted from Matsumoto et al with permission of the publisher. Copyright ©2015, Elsevier.
Figure 4.
Figure 4.
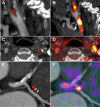
Positron emission tomography (PET) inflammation imaging. Computed tomographic (CT) angiography of symptomatic left internal carotid stenosis (arrows); sagittal (A) and axial (C) views. B, D, Fused 18F-fluorodeoxyglucose (FDG) PET–CT demonstrates high uptake relating to the symptomatic carotid plaque. E, Coronary CT angiogram of left circumflex coronary artery lesion (red arrow) with spotty calcification (white arrows); F, fused 68Ga-DOTATATE PET–CT demonstrates high signal in relation to the inflamed coronary plaque.
Figure 5.
Figure 5.
Shear stress simulation and plaque progression. 3D coronary reconstruction at baseline (A) and 3-year follow-up (C); outer vessel-wall shown in a semitransparent fashion to allow visualization of plaque distribution. B, E, Shear stress simulation performed at baseline; low stress shown in blue and high in red. Plaque burden at baseline (D) and follow-up (F); green indicates minimal thickness and red increased plaque thickness. There is significant plaque progression in the region of low shear stress at baseline (circle). Image courtesy of Dr Christos Bourantas.
Figure 6.
Figure 6.
Prediction of acute coronary syndrome (ACS) by high-risk computed tomographic (CT) features. Results of prospective imaging study involving 3158 patients, aimed to evaluate whether CT-derived plaque characteristics can predict midterm likelihood of ACS. Cumulative event rate for patients with high-risk CT features (high-risk plaque [HRP] (+); low attenuation or positive remodeled plaque) identified at baseline vs those without high-risk CT features (HRP (−); A). Although the event rate in HRP (+) patients is higher than HRP (−), the number of patients in the HRP (+) group was 10-fold lower resulting in a similar cumulative number of events among the 2 groups (B). Adapted from Motoyama et al with permission of the publisher. Copyright ©2015, Elsevier.
Figure 7.
Figure 7.
Effects of statins on plaque morphology evaluated by intravascular imaging. Summary of a post hoc analysis of 8 prospective randomized trials using serial intravascular ultrasound to detect change in percent atheroma volume (PAV; A), total atheroma volume (TAV; B), and calcium index (Cal) in response to low-intensity statin treatment (LIST) and high-intensity statin treatment (HIST). Significant plaque regression, with increased coronary atheroma calcification is observed in both low- and high-dose statin groups. Adapted from Puri et al with permission of the publisher. Copyright ©2015, Elsevier.
Figure 8.
Figure 8.
Cardiac motion-corrected 18F-NaF positron emission tomography (PET). 3D cardiac computed tomographic (CT) rendering with superimposed 18F-NaF cardiac-gated PET image reconstruction using a single bin (25% of PET counts) vs (B) motion corrected PET with 10-gated bin method (consecutive 10% segments), resulting in less noise and improved target to background ratio. Adapted from Rubeaux et al with permission of the publisher. Copyright ©2016, Society of Nuclear Medicine and Molecular Imaging, Inc. LAD indicates left anterior descending artery; LCx, left circumflex artery; and RCA, right coronary artery.

References

    1. Libby P. Inflammation in atherosclerosis. Arterioscler Thromb Vasc Biol. 2012;32:2045–2051. doi: 10.1161/ATVBAHA.108.179705. - PMC - PubMed
    1. Bentzon JF, Otsuka F, Virmani R, Falk E. Mechanisms of plaque formation and rupture. Circ Res. 2014;114:1852–1866. doi: 10.1161/CIRCRESAHA.114.302721. - PubMed
    1. Go AS, Mozaffarian D, Roger VL, et al. American Heart Association Statistics Committee and Stroke Statistics Subcommittee. Heart disease and stroke statistics–2014 update: a report from the American Heart Association. Circulation. 2014;129:e28–e292. doi: 10.1161/01.cir.0000441139.02102.80. - PMC - PubMed
    1. Moran AE, Forouzanfar MH, Roth GA, Mensah GA, Ezzati M, Murray CJ, Naghavi M. Temporal trends in ischemic heart disease mortality in 21 world regions, 1980 to 2010: the Global Burden of Disease 2010 study. Circulation. 2014;129:1483–1492. doi: 10.1161/CIRCULATIONAHA.113.004042. - PMC - PubMed
    1. Joshi NV, Vesey AT, Williams MC, et al. 18F-fluoride positron emission tomography for identification of ruptured and high-risk coronary atherosclerotic plaques: a prospective clinical trial. Lancet. 2014;383:705–713. doi: 10.1016/S0140-6736(13)61754-7. - PubMed

Publication types

MeSH terms