Meta-Analysis
. 2016 May;107(5):690-9.
doi: 10.1111/cas.12910. Epub 2016 Mar 18.

Genetic variation frequencies in Wilms' tumor: A meta-analysis and systematic review

Affiliations
Meta-Analysis

Genetic variation frequencies in Wilms' tumor: A meta-analysis and systematic review

Changkai Deng et al. Cancer Sci. 2016 May.

Abstract

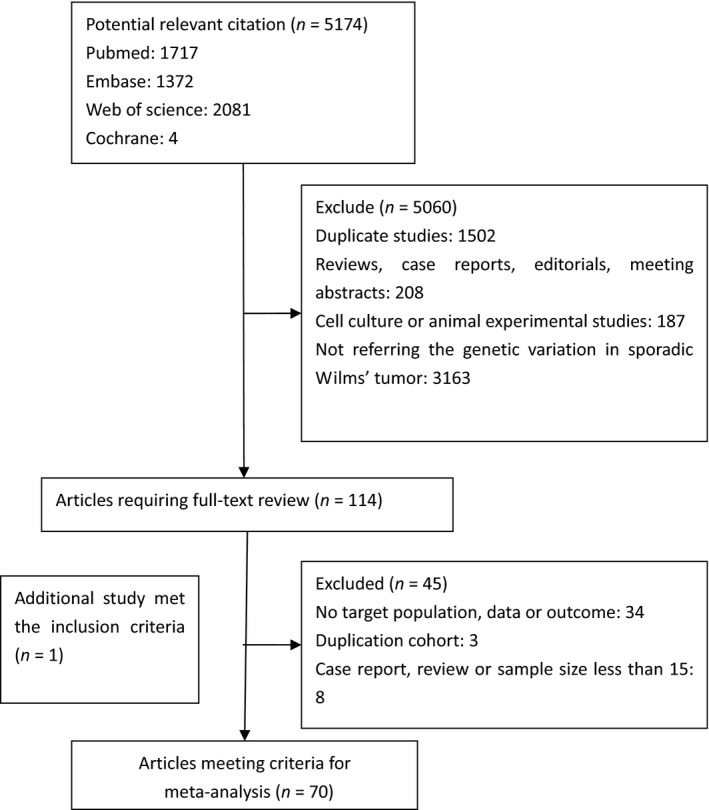
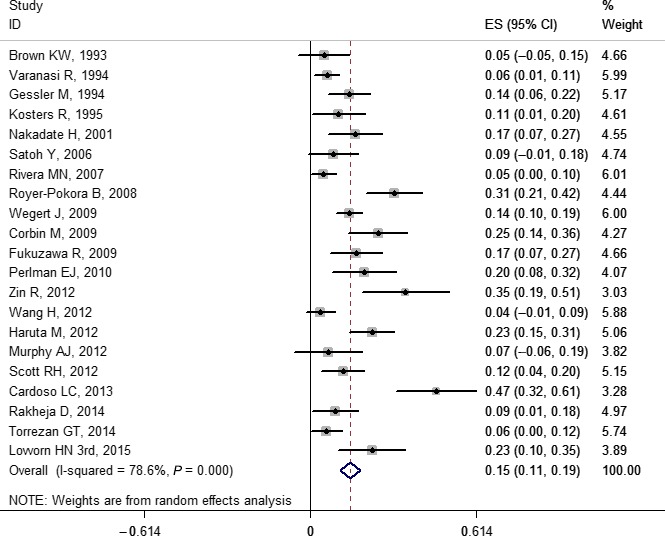
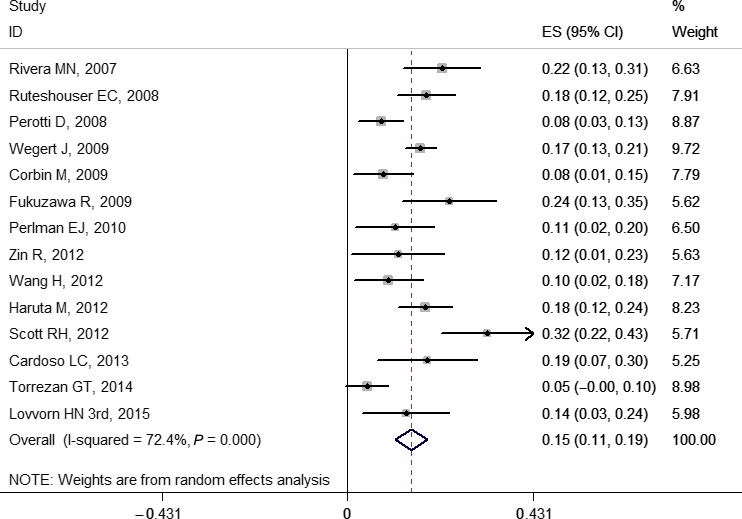
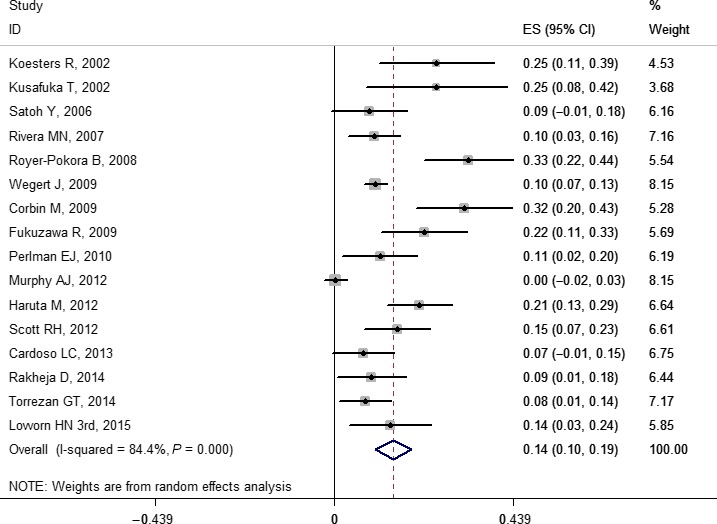
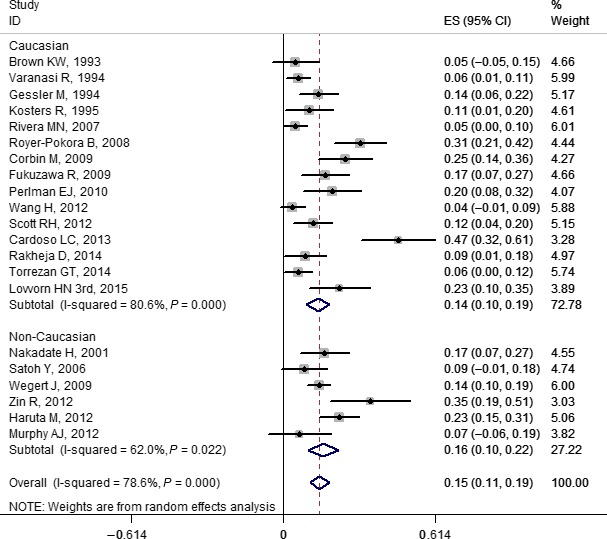
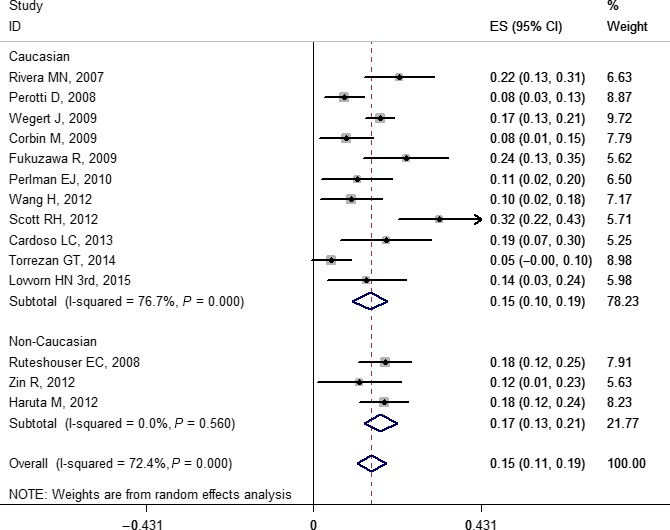
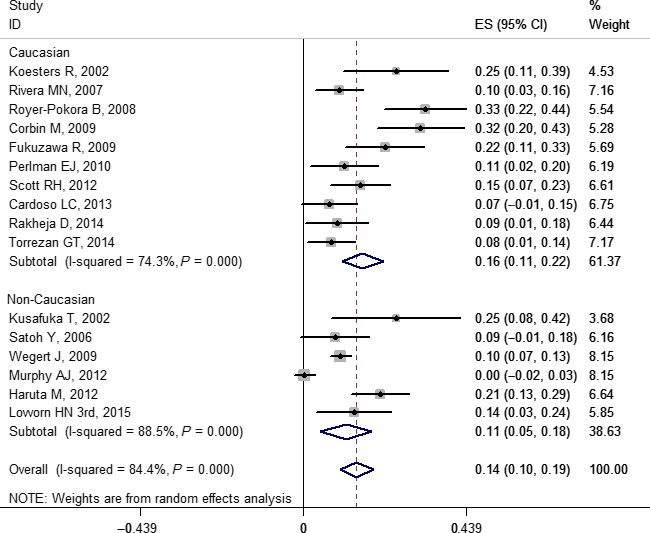
Over the last few decades, numerous biomarkers in Wilms' tumor have been confirmed and shown variations in prevalence. Most of these studies were based on small sample sizes. We carried out a meta-analysis of the research published from 1992 to 2015 to obtain more precise and comprehensive outcomes for genetic tests. In the present study, 70 out of 5175 published reports were eligible for the meta-analysis, which was carried out using Stata 12.0 software. Pooled prevalence for gene mutations WT1, WTX, CTNNB1, TP53, MYCN, DROSHA, and DGCR8 was 0.141 (0.104, 0.178), 0.147 (0.110, 0.184), 0.140 (0.100, 0.190), 0.410 (0.214, 0.605), 0.071 (0.041, 0.100), 0.082 (0.048, 0.116), and 0.036 (0.026, 0.046), respectively. Pooled prevalence of loss of heterozygosity at 1p, 11p, 11q, 16q, and 22q was 0.109 (0.084, 0.133), 0.334 (0.295, 0.373), 0.199 (0.146, 0.252), 0.151 (0.129, 0.172), and 0.148 (0.108, 0.189), respectively. Pooled prevalence of 1q and chromosome 12 gain was 0.218 (0.161, 0.275) and 0.273 (0.195, 0.350), respectively. The limited prevalence of currently known genetic alterations in Wilms' tumors indicates that significant drivers of initiation and progression remain to be discovered. Subgroup analyses indicated that ethnicity may be one of the sources of heterogeneity. However, in meta-regression analyses, no study-level characteristics of indicators were found to be significant. In addition, the findings of our sensitivity analysis and possible publication bias remind us to interpret results with caution.

Keywords: Children; Wilms' tumor; genetic variations; meta-analysis; prevalence.


Figures

Figure 1
Figure 1
Flow chart of the selection of relevant published works regarding genetic variation frequencies in Wilms' tumor. Of 5174 potentially eligible publications, 5060 were excluded after screening of titles and abstracts. Sixty‐nine eligible articles were included from 114 included in our full‐text selection. The reasons for exclusion were: lack of target data, population, or outcome (34 studies), analysis of the same cohort (three studies), and case reports, reviews, or sample size <15 cases (eight studies). One additional publication was found through reference screening. Finally, 70 articles met the criteria for our meta‐analysis.
Figure 2
Figure 2
Forest plot for frequency of WT1 gene mutation in Wilms' tumor. Studies are plotted according to the first author's name and publication year. Horizontal lines represent 95% confidence interval (CI). Each square represents the prevalence point estimate and its size is proportional to the weight of the study. The diamond (and broken line) represents the overall summary estimate, with confidence interval given by its width. The unbroken vertical line is at the null value (prevalence = 0). ES, effect size.
Figure 3
Figure 3
Forest plot for frequency of WTX gene mutation in Wilms' tumor. Studies are plotted according to the first author's name and publication year. Horizontal lines represent 95% confidence interval (CI). Each square represents the prevalence point estimate and its size is proportional to the weight of the study. The diamond (and broken line) represents the overall summary estimate, with confidence interval given by its width. The unbroken vertical line is at the null value (prevalence = 0). ES, effect size.
Figure 4
Figure 4
Forest plot for frequency of CTNNB1 gene mutation in Wilms' tumor. Studies are plotted according to the first author's name and publication year. Horizontal lines represent 95% confidence interval (CI). Each square represents the prevalence point estimate and its size is proportional to the weight of the study. The diamond (and broken line) represents the overall summary estimate, with confidence interval given by its width. The unbroken vertical line is at the null value (prevalence = 0). ES, effect size.
Figure 5
Figure 5
Forest plot for frequency of WT1 gene mutation in Wilms' tumor stratified by ethnicity. Studies are plotted according to the first author's name and publication year. Horizontal lines represent 95% confidence interval (CI). Each square represents the prevalence point estimate and its size is proportional to the weight of the study. The diamond (and broken line) represents the overall summary estimate, with CI given by its width. The unbroken vertical line is at the null value (prevalence = 0). ES, effect size.
Figure 6
Figure 6
Forest plot for frequency of WTX gene mutation in Wilms' tumor stratified by ethnicity. Studies are plotted according to the first author's name and publication year. Horizontal lines represent 95% confidence interval (CI). Each square represents the prevalence point estimate and its size is proportional to the weight of the study. The diamond (and broken line) represents the overall summary estimate, with confidence interval given by its width. The unbroken vertical line is at the null value (prevalence = 0). ES, effect size.
Figure 7
Figure 7
Forest plot for frequency of CTNNB1 gene mutation in Wilms' tumor stratified by ethnicity. Studies are plotted according to the first author's name and publication year. Horizontal lines represent 95% confidence interval CI. Each square represents the prevalence point estimate and its size is proportional to the weight of the study. The diamond (and broken line) represents the overall summary estimate, with confidence interval given by its width. The unbroken vertical line is at the null value (prevalence = 0). ES, effect size.

References

    1. Stiller CA, Parkin DM. International variations in the incidence of childhood renal tumours. Br J Cancer 1990; 62: 1026–30. - PMC - PubMed
    1. Breslow NE, Beckwith JB, Perlman EJ, Reeve AE. Age distributions, birth weights, nephrogenic rests, and heterogeneity in the pathogenesis of Wilms tumor. Pediatr Blood Cancer 2006; 47: 260–7. - PMC - PubMed
    1. Breslow NE, Olson J, Moksness J, Beckwith JB, Grundy P. Familial Wilms' tumor: a descriptive study. Med Pediatr Oncol 1996; 27: 398–403. - PubMed
    1. Mcdonald JM, Douglass EC, Fisher R et al Linkage of familial Wilms' tumor predisposition to chromosome 19 and a two‐locus model for the etiology of familial tumors. Cancer Res 1998; 58: 1387–90. - PubMed
    1. Rahman N, Arbour L, Tonin P et al Evidence for a familial Wilms' tumour gene (FWT1) on chromosome 17q12‐q21. Nat Genet 1996; 13: 461–3. - PubMed