

Clustering Genes of Common Evolutionary History
- PMID: 26893301
- PMCID: PMC4868114
- DOI: 10.1093/molbev/msw038
Clustering Genes of Common Evolutionary History
Abstract
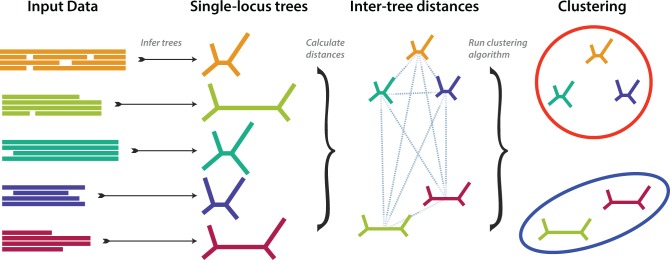
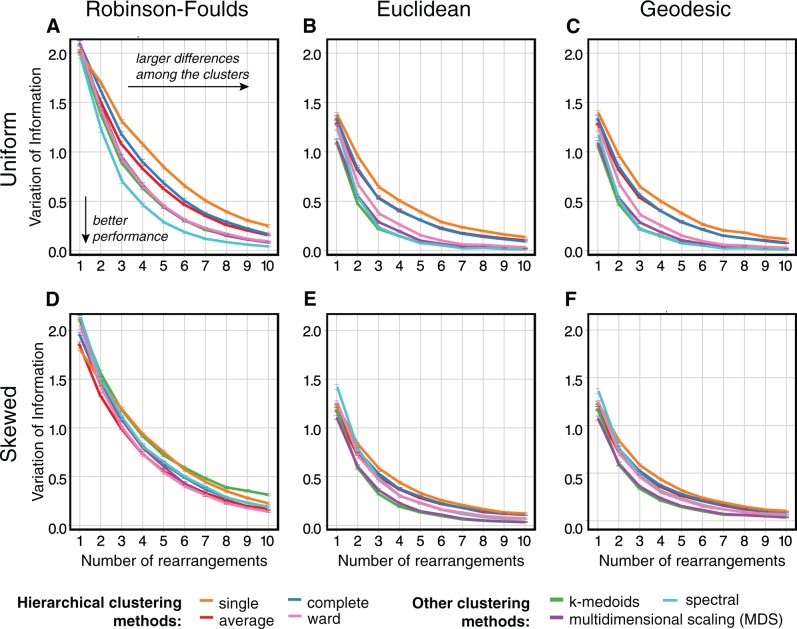
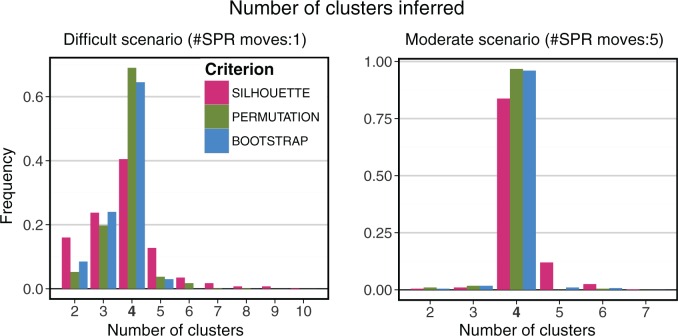
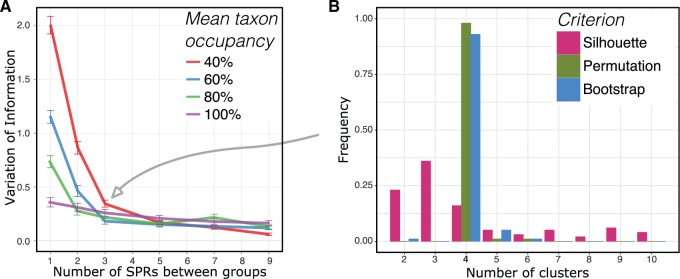
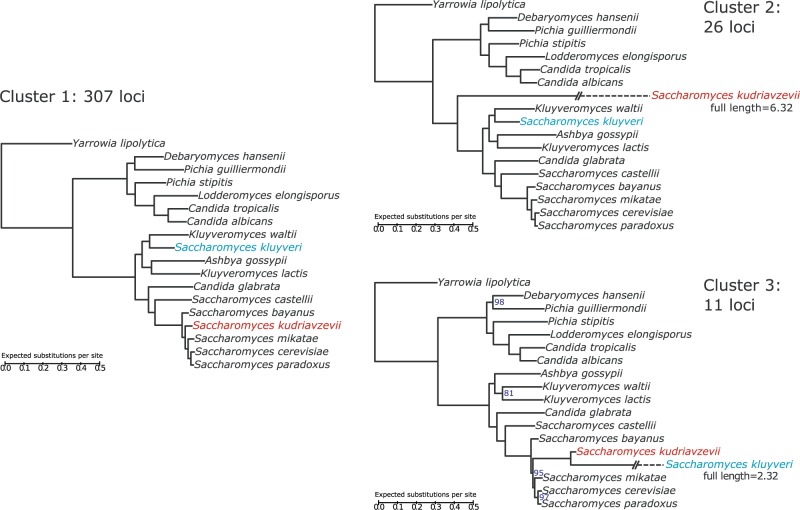
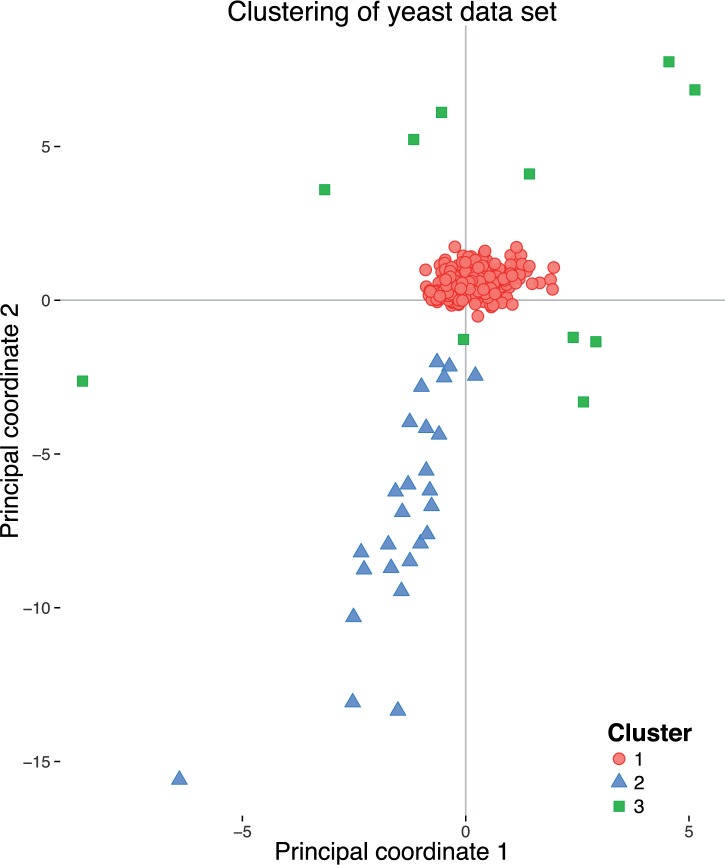
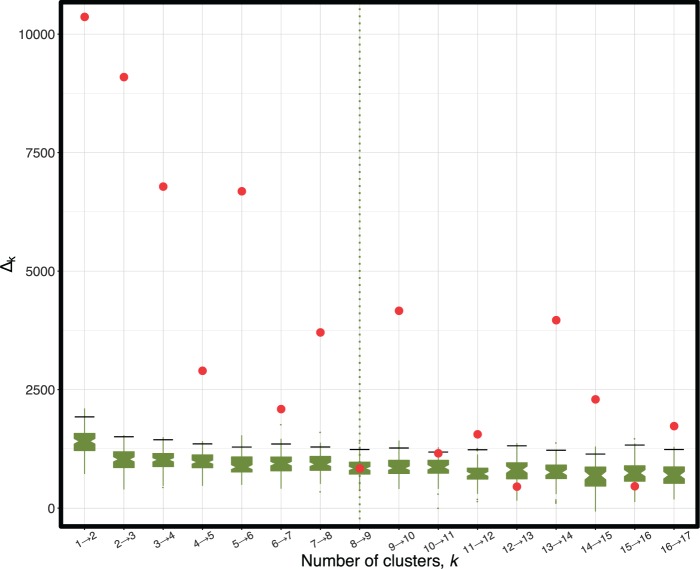
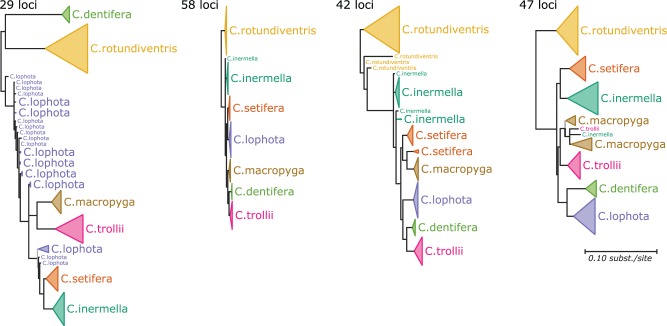
Phylogenetic inference can potentially result in a more accurate tree using data from multiple loci. However, if the loci are incongruent-due to events such as incomplete lineage sorting or horizontal gene transfer-it can be misleading to infer a single tree. To address this, many previous contributions have taken a mechanistic approach, by modeling specific processes. Alternatively, one can cluster loci without assuming how these incongruencies might arise. Such "process-agnostic" approaches typically infer a tree for each locus and cluster these. There are, however, many possible combinations of tree distance and clustering methods; their comparative performance in the context of tree incongruence is largely unknown. Furthermore, because standard model selection criteria such as AIC cannot be applied to problems with a variable number of topologies, the issue of inferring the optimal number of clusters is poorly understood. Here, we perform a large-scale simulation study of phylogenetic distances and clustering methods to infer loci of common evolutionary history. We observe that the best-performing combinations are distances accounting for branch lengths followed by spectral clustering or Ward's method. We also introduce two statistical tests to infer the optimal number of clusters and show that they strongly outperform the silhouette criterion, a general-purpose heuristic. We illustrate the usefulness of the approach by 1) identifying errors in a previous phylogenetic analysis of yeast species and 2) identifying topological incongruence among newly sequenced loci of the globeflower fly genus Chiastocheta We release treeCl, a new program to cluster genes of common evolutionary history (http://git.io/treeCl).
Keywords: clustering; incomplete lineage sorting.; incongruence; nonorthology; phylogeny; process-agnostic.
© The Author 2016. Published by Oxford University Press on behalf of the Society for Molecular Biology and Evolution.
Figures

Similar articles
-
Species tree inference by minimizing deep coalescences.PLoS Comput Biol. 2009 Sep;5(9):e1000501. doi: 10.1371/journal.pcbi.1000501. Epub 2009 Sep 11. PLoS Comput Biol. 2009. PMID: 19749978 Free PMC article.
-
Comparing species tree estimation with large anchored phylogenomic and small Sanger-sequenced molecular datasets: an empirical study on Malagasy pseudoxyrhophiine snakes.BMC Evol Biol. 2015 Oct 12;15:221. doi: 10.1186/s12862-015-0503-1. BMC Evol Biol. 2015. PMID: 26459325 Free PMC article.
-
A new fast method for inferring multiple consensus trees using k-medoids.BMC Evol Biol. 2018 Apr 5;18(1):48. doi: 10.1186/s12862-018-1163-8. BMC Evol Biol. 2018. PMID: 29621975 Free PMC article.
-
Tree disagreement: measuring and testing incongruence in phylogenies.J Biomed Inform. 2006 Feb;39(1):86-102. doi: 10.1016/j.jbi.2005.08.008. Epub 2005 Sep 28. J Biomed Inform. 2006. PMID: 16243006 Review.
-
Identifying and addressing methodological incongruence in phylogenomics: A review.Evol Appl. 2023 Jun 6;16(6):1087-1104. doi: 10.1111/eva.13565. eCollection 2023 Jun. Evol Appl. 2023. PMID: 37360032 Free PMC article. Review.
Cited by
-
DiscoSnp-RAD: de novo detection of small variants for RAD-Seq population genomics.PeerJ. 2020 Jun 10;8:e9291. doi: 10.7717/peerj.9291. eCollection 2020. PeerJ. 2020. PMID: 32566401 Free PMC article.
-
Principal component analysis and the locus of the Fréchet mean in the space of phylogenetic trees.Biometrika. 2017 Dec;104(4):901-922. doi: 10.1093/biomet/asx047. Epub 2017 Sep 27. Biometrika. 2017. PMID: 29422694 Free PMC article.
-
A Semi-Automated SNP-Based Approach for Contaminant Identification in Biparental Polyploid Populations of Tropical Forage Grasses.Front Plant Sci. 2021 Oct 22;12:737919. doi: 10.3389/fpls.2021.737919. eCollection 2021. Front Plant Sci. 2021. PMID: 34745171 Free PMC article.
-
SWPhylo - A Novel Tool for Phylogenomic Inferences by Comparison of Oligonucleotide Patterns and Integration of Genome-Based and Gene-Based Phylogenetic Trees.Evol Bioinform Online. 2018 Feb 20;14:1176934318759299. doi: 10.1177/1176934318759299. eCollection 2018. Evol Bioinform Online. 2018. PMID: 29511354 Free PMC article.
-
UNSUPERVISED CLUSTERING OF AIRWAY TREE STRUCTURES ON HIGH-RESOLUTION CT: THE MESA LUNG STUDY.Proc IEEE Int Symp Biomed Imaging. 2021 Apr;2021:1568-1572. doi: 10.1109/isbi48211.2021.9434172. Epub 2021 May 25. Proc IEEE Int Symp Biomed Imaging. 2021. PMID: 39399779 Free PMC article.
References
-
- Akaike H. 1974. A new look at the statistical model identification. IEEE Trans Automat Control. 19:716–723.
-
- Ané C, Larget B, Baum DA, Smith SD, Rokas A. 2007. Bayesian estimation of concordance among gene trees. Mol Biol Evol. 24:412–426. - PubMed
-
- Antoniak CE. 1974. Mixtures of Dirichlet processes with applications to Bayesian nonparametric problems. Ann Stat. 2:1152–1174.
Publication types
MeSH terms
LinkOut - more resources
Full Text Sources
Other Literature Sources
Molecular Biology Databases
