

Introgression maintains the genetic integrity of the mating-type determining chromosome of the fungus Neurospora tetrasperma
- PMID: 26893460
- PMCID: PMC4817772
- DOI: 10.1101/gr.197244.115
Introgression maintains the genetic integrity of the mating-type determining chromosome of the fungus Neurospora tetrasperma
Abstract
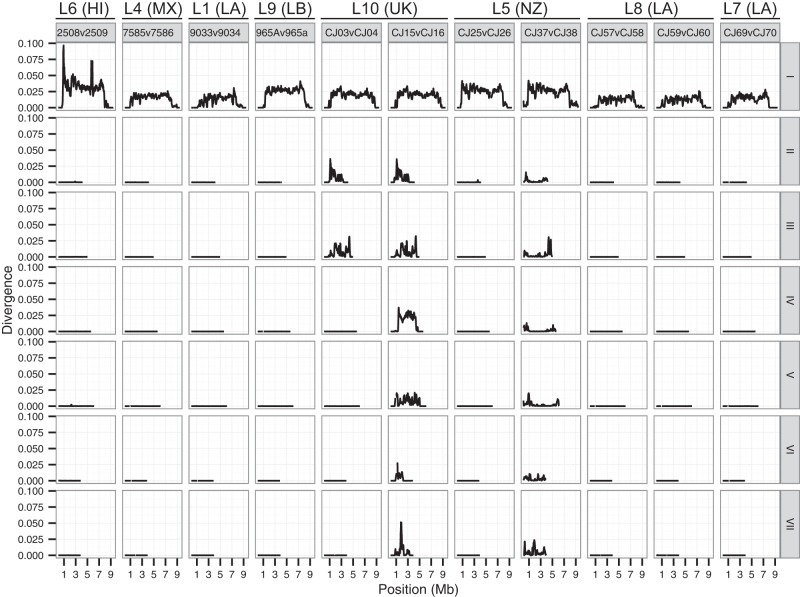
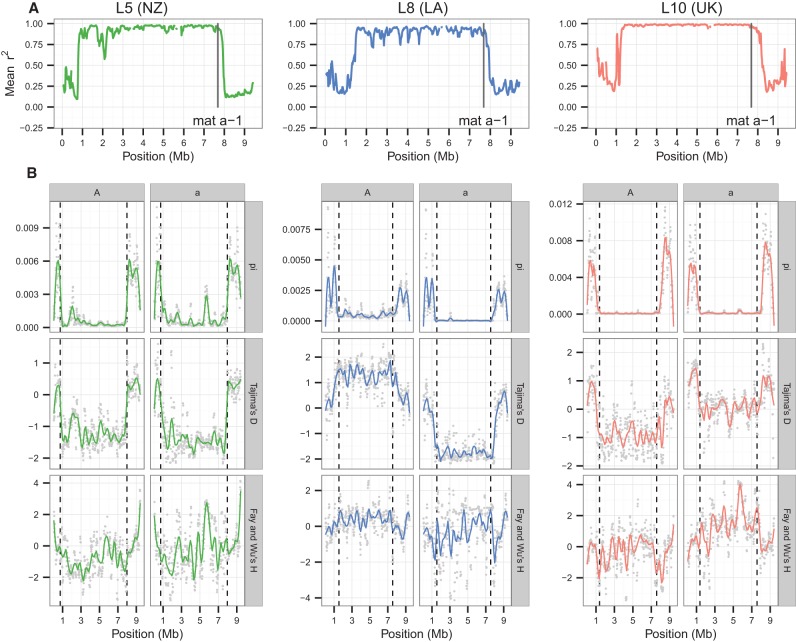
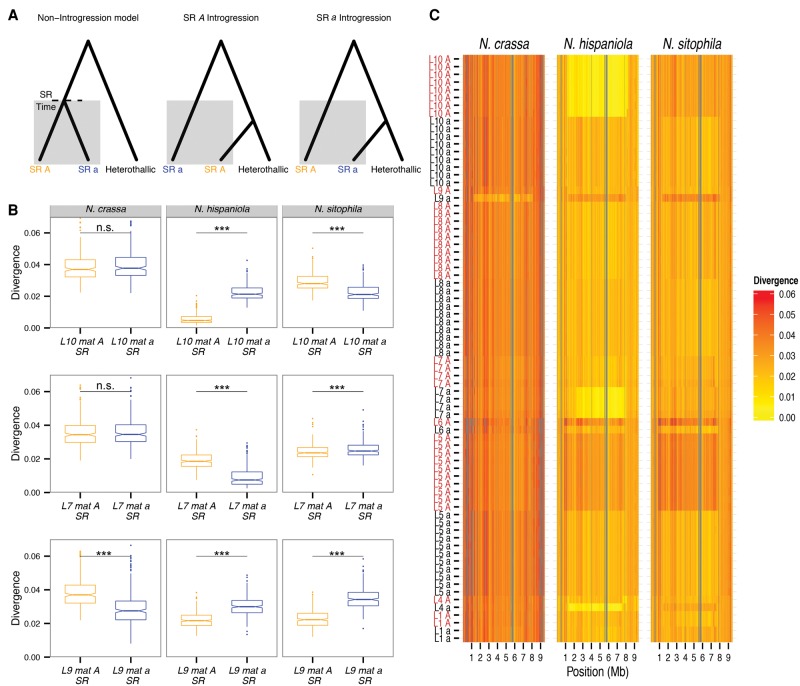
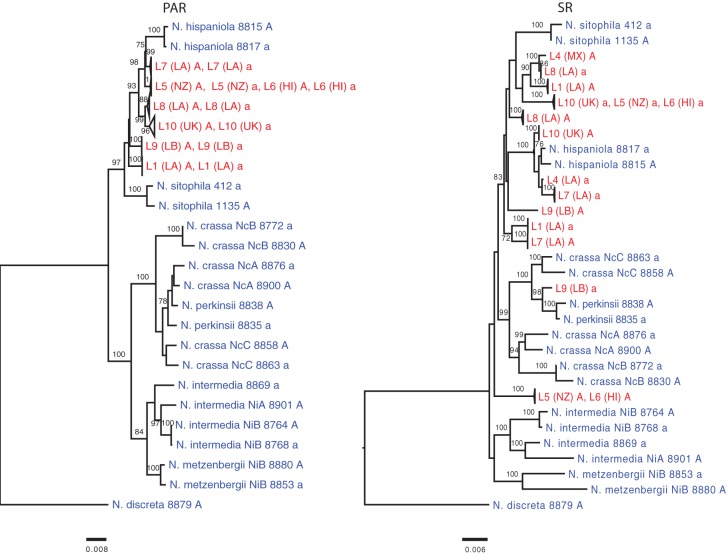
Genome evolution is driven by a complex interplay of factors, including selection, recombination, and introgression. The regions determining sexual identity are particularly dynamic parts of eukaryotic genomes that are prone to molecular degeneration associated with suppressed recombination. In the fungus Neurospora tetrasperma, it has been proposed that this molecular degeneration is counteracted by the introgression of nondegenerated DNA from closely related species. In this study, we used comparative and population genomic analyses of 92 genomes from eight phylogenetically and reproductively isolated lineages of N. tetrasperma, and its three closest relatives, to investigate the factors shaping the evolutionary history of the genomes.We found that suppressed recombination extends across at least 6 Mbp (∼ 63%) of the mating-type (mat) chromosome in N. tetrasperma and is associated with decreased genetic diversity, which is likely the result primarily of selection at linked sites. Furthermore, analyses of molecular evolution revealed an increased mutational load in this region, relative to recombining regions. However, comparative genomic and phylogenetic analyses indicate that the mat chromosomes are temporarily regenerated via introgression from sister species; six of eight lineages show introgression into one of their mat chromosomes, with multiple Neurospora species acting as donors. The introgressed tracts have been fixed within lineages, suggesting that they confer an adaptive advantage in natural populations, and our analyses support the presence of selective sweeps in at least one lineage. Thus, these data strongly support the previously hypothesized role of introgression as a mechanism for the maintenance of mating-type determining chromosomal regions.
© 2016 Corcoran et al.; Published by Cold Spring Harbor Laboratory Press.
Figures

Similar articles
-
Large-scale introgression shapes the evolution of the mating-type chromosomes of the filamentous ascomycete Neurospora tetrasperma.PLoS Genet. 2012;8(7):e1002820. doi: 10.1371/journal.pgen.1002820. Epub 2012 Jul 26. PLoS Genet. 2012. PMID: 22844246 Free PMC article.
-
Gene genealogies indicates abundant gene conversions and independent evolutionary histories of the mating-type chromosomes in the evolutionary history of Neurospora tetrasperma.BMC Evol Biol. 2010 Jul 31;10:234. doi: 10.1186/1471-2148-10-234. BMC Evol Biol. 2010. PMID: 20673371 Free PMC article.
-
The mating-type chromosome in the filamentous ascomycete Neurospora tetrasperma represents a model for early evolution of sex chromosomes.PLoS Genet. 2008 Mar 14;4(3):e1000030. doi: 10.1371/journal.pgen.1000030. PLoS Genet. 2008. PMID: 18369449 Free PMC article.
-
Neurospora as a model to empirically test central hypotheses in eukaryotic genome evolution: why this fungal genus offers promising opportunities.Bioessays. 2012 Nov;34(11):934-7. doi: 10.1002/bies.201200110. Epub 2012 Sep 12. Bioessays. 2012. PMID: 22968834 Review.
-
Recombination suppression and evolutionary strata around mating-type loci in fungi: documenting patterns and understanding evolutionary and mechanistic causes.New Phytol. 2021 Mar;229(5):2470-2491. doi: 10.1111/nph.17039. Epub 2020 Dec 1. New Phytol. 2021. PMID: 33113229 Free PMC article. Review.
Cited by
-
Recent admixture between species of the fungal pathogen Histoplasma.Evol Lett. 2018 Jun 22;2(3):210-220. doi: 10.1002/evl3.59. eCollection 2018 Jun. Evol Lett. 2018. PMID: 30283677 Free PMC article.
-
The Sordariomycetes: an expanding resource with Big Data for mining in evolutionary genomics and transcriptomics.Front Fungal Biol. 2023 Jun 30;4:1214537. doi: 10.3389/ffunb.2023.1214537. eCollection 2023. Front Fungal Biol. 2023. PMID: 37746130 Free PMC article. Review.
-
Genetic and Genomic Analyses Reveal Boundaries between Species Closely Related to Cryptococcus Pathogens.mBio. 2019 Jun 11;10(3):e00764-19. doi: 10.1128/mBio.00764-19. mBio. 2019. PMID: 31186317 Free PMC article.
-
The Role of Transposable Elements in Speciation.Genes (Basel). 2018 May 15;9(5):254. doi: 10.3390/genes9050254. Genes (Basel). 2018. PMID: 29762547 Free PMC article. Review.
-
Neurospora from Natural Populations: Population Genomics Insights into the Life History of a Model Microbial Eukaryote.Methods Mol Biol. 2020;2090:313-336. doi: 10.1007/978-1-0716-0199-0_13. Methods Mol Biol. 2020. PMID: 31975173 Review.
References
-
- Bachtrog D. 2004. Evidence that positive selection drives Y-chromosome degeneration in Drosophila miranda. Nat Genet 36: 518–522. - PubMed
-
- Bachtrog D, Charlesworth B. 2002. Reduced adaptation of a non-recombining neo-Y chromosome. Nature 416: 323–326. - PubMed
-
- Betancourt AJ, Welch JJ, Charlesworth B. 2009. Reduced effectiveness of selection caused by a lack of recombination. Curr Biol 19: 655–660. - PubMed
Publication types
MeSH terms
LinkOut - more resources
Full Text Sources
Other Literature Sources
Miscellaneous