

Leaf Dynamics of Panicum maximum under Future Climatic Changes
- PMID: 26894932
- PMCID: PMC4760759
- DOI: 10.1371/journal.pone.0149620
Leaf Dynamics of Panicum maximum under Future Climatic Changes
Abstract
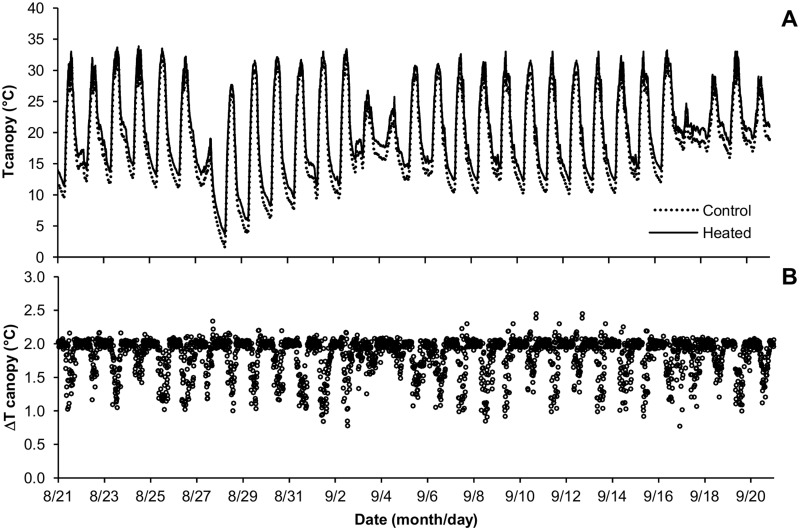
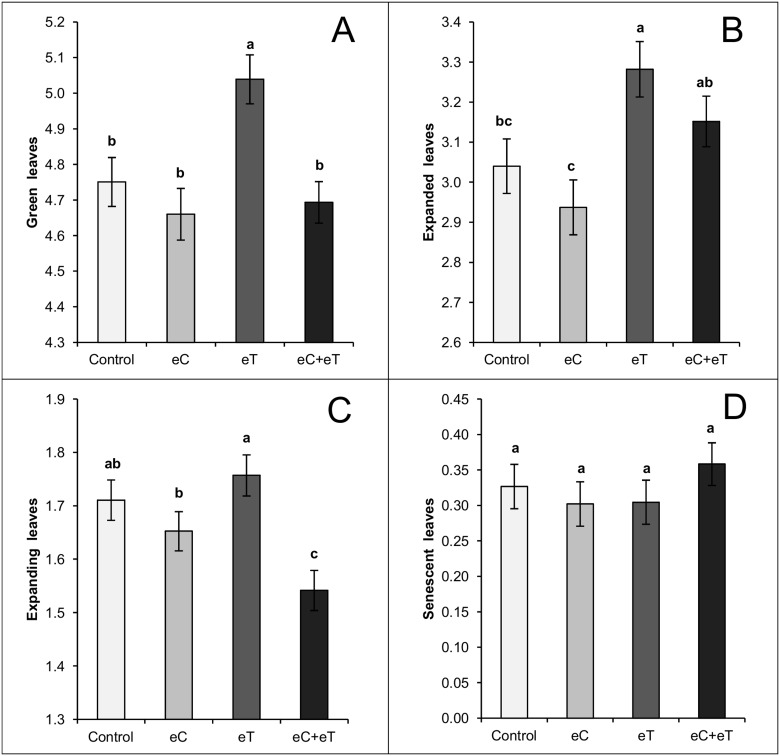
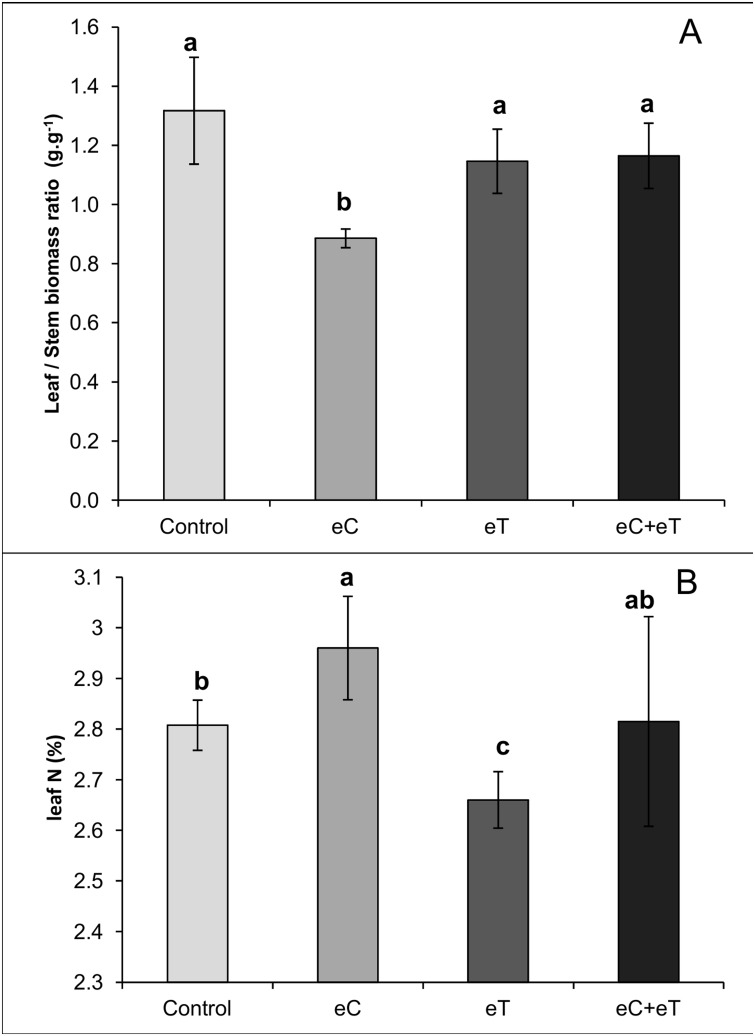
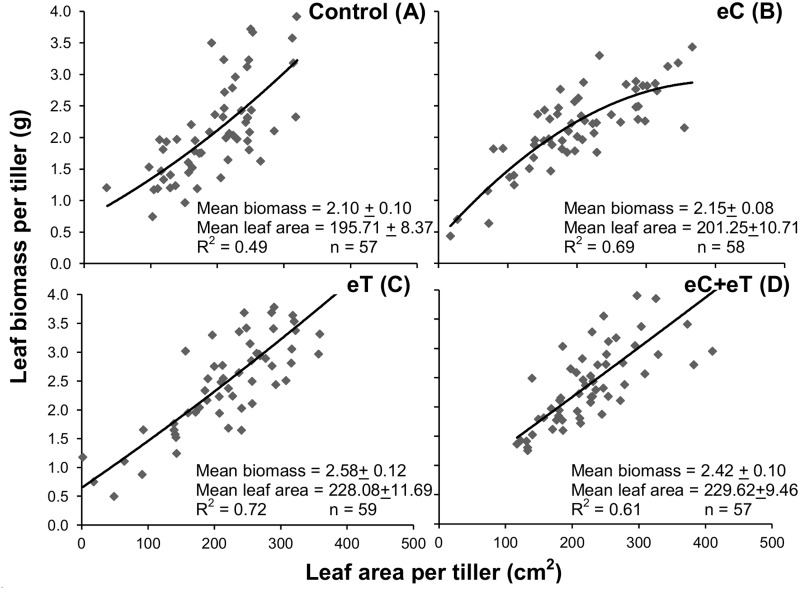
Panicum maximum Jacq. 'Mombaça' (C4) was grown in field conditions with sufficient water and nutrients to examine the effects of warming and elevated CO2 concentrations during the winter. Plants were exposed to either the ambient temperature and regular atmospheric CO2 (Control); elevated CO2 (600 ppm, eC); canopy warming (+2°C above regular canopy temperature, eT); or elevated CO2 and canopy warming (eC+eT). The temperatures and CO2 in the field were controlled by temperature free-air controlled enhancement (T-FACE) and mini free-air CO2 enrichment (miniFACE) facilities. The most green, expanding, and expanded leaves and the highest leaf appearance rate (LAR, leaves day(-1)) and leaf elongation rate (LER, cm day(-1)) were observed under eT. Leaf area and leaf biomass were higher in the eT and eC+eT treatments. The higher LER and LAR without significant differences in the number of senescent leaves could explain why tillers had higher foliage area and leaf biomass in the eT treatment. The eC treatment had the lowest LER and the fewest expanded and green leaves, similar to Control. The inhibitory effect of eC on foliage development in winter was indicated by the fewer green, expanded, and expanding leaves under eC+eT than eT. The stimulatory and inhibitory effects of the eT and eC treatments, respectively, on foliage raised and lowered, respectively, the foliar nitrogen concentration. The inhibition of foliage by eC was confirmed by the eC treatment having the lowest leaf/stem biomass ratio and by the change in leaf biomass-area relationships from linear or exponential growth to rectangular hyperbolic growth under eC. Besides, eC+eT had a synergist effect, speeding up leaf maturation. Therefore, with sufficient water and nutrients in winter, the inhibitory effect of elevated CO2 on foliage could be partially offset by elevated temperatures and relatively high P. maximum foliage production could be achieved under future climatic change.
Conflict of interest statement
Figures


References
-
- CO2 now. 2015. Available: http://co2now.org/ (accessed: June 2015).
-
- National Oceanic and Atmospheric Administration. 2015. Available: http://www.noaa.gov (accessed: June 2015).
-
- IPCC. 2014. Climate change 2014: impacts, adaptation, and vulnerability In: Field CB, Barros VR, Dokken DJ, Mach KJ, Mastrandrea MD, Bilir TE, Chatterjee M, Ebi KL, Estrada YO, Genova RC, Girma B, Kissel ES, Levy AN, MacCracken S, Mastrandrea PR, White L, editors. Part A: global and sectoral aspects. Working Group II contribution to the Fifth Assessment Report of the Intergovernmental Panel on Climate Change. Cambridge, United Kingdom and New York, NY, USA: Cambridge University Press; 2014. p. 1132.
-
- Bloom AJ. 2010. Global climate change, convergence of disciplines. Massachusetts: Sinauer Associates; 2010.
-
- Bazzaz FA. The response of natural ecosystems to the rising global CO2 levels. Annu Rev Ecol Syst. 1990; 21: 167–196.
Publication types
MeSH terms
Substances
LinkOut - more resources
Full Text Sources
Other Literature Sources
Medical
Miscellaneous
